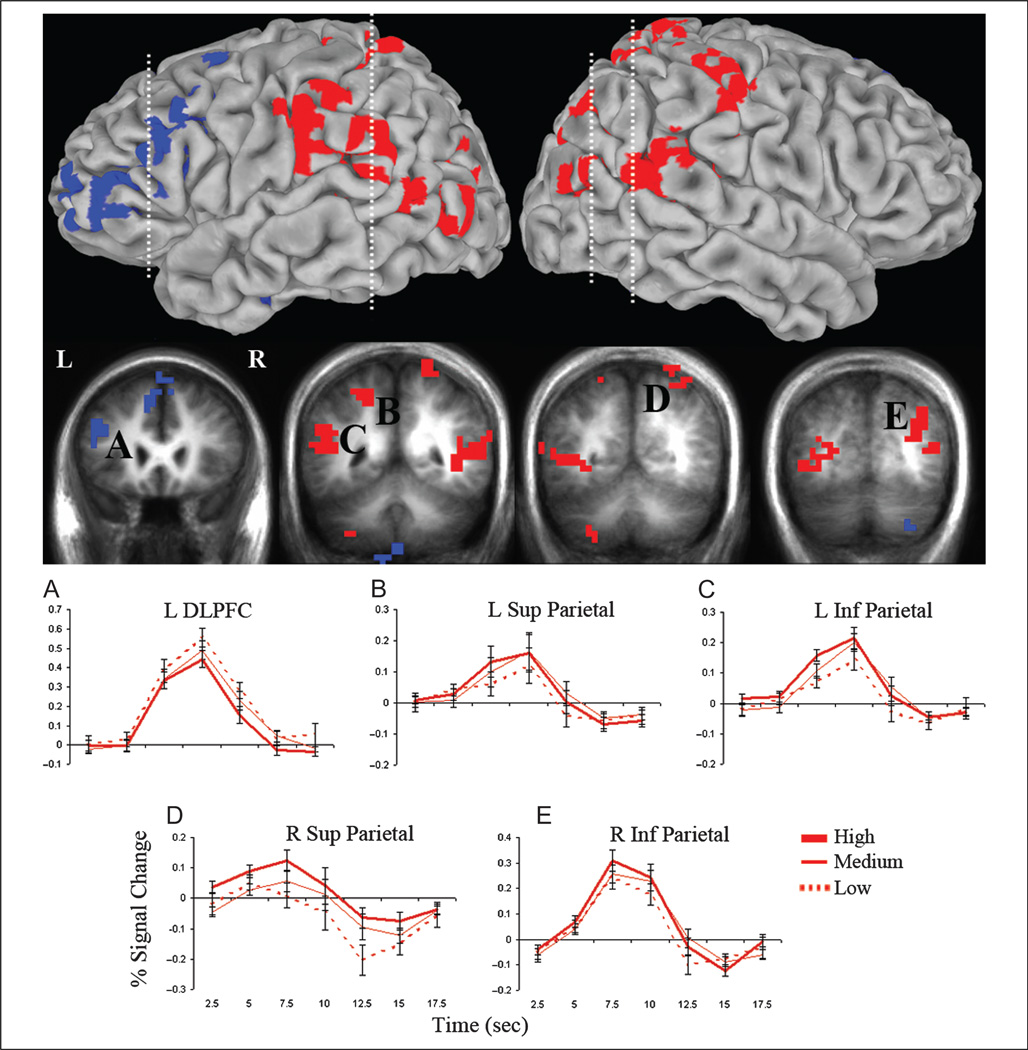
Figure 5.
Regions modulated by memory strength but not significantly activated by search. Statistical activation map showing areas with increasing (red) or decreasing (blue) activity with increasing study level during recall (p < .05, corrected for multiple comparisons), with an exclusion mask of regions in which activity differed (p < .05) between the forgotten and classify trials. Clusters are overlaid on the lateral pial surface of the Talairach and Tournoux N27 average brain and coronal cross-sections (indicated with dashed lines) of the mean anatomical image of all participants. Graphs display the time course of the percent signal change (±SE) in the left DLPFC (A) and left and right superior (B, D) and inferior (C, E) parietal cortex for low-, medium-, and high-study recall conditions.

