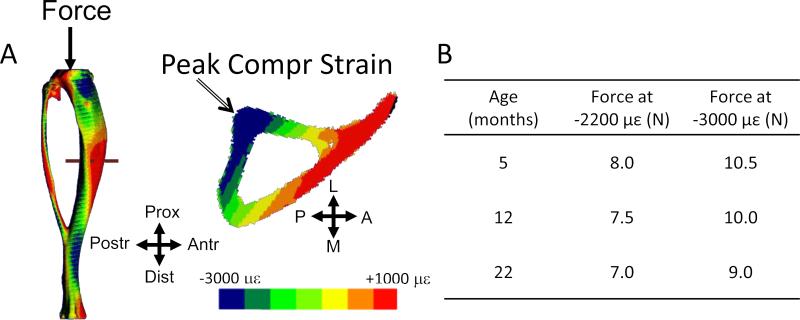
Figure 1.
(A) Contour plots of axial strain engendered by tibial compression (adapted from Patel et al., 2014, with permission). Shown is a 5-month sample at a force of 10 N. The peak tibial strain magnitude is compressive and occurs at the postero-lateral apex of the cross-section (arrow). The force magnitudes required to generate peak strains of –2200 and –3000 microstrain (με) in female C57Bl/6 mice were determined from strain gauge measurements [28] and are shown in the (B) table. L: Lateral, A: Anterior, M: Medial, P: Posterior.

