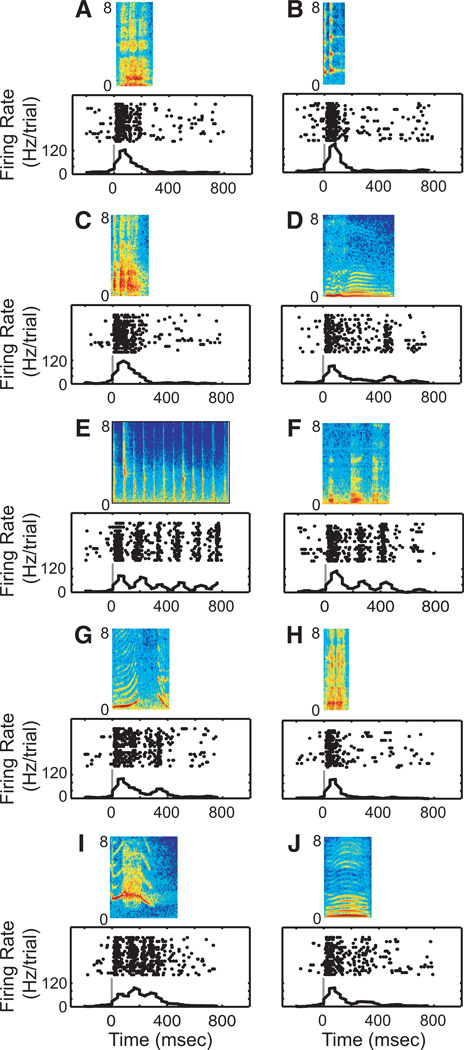
Fig. 2.
Response profile of STG neuron to each of the 10 vocalization exemplars: aggressive (A), copulation scream (B), grunt (C), coo (D), gecker (E), girney (F), harmonic arch (G), shrill bark (H), scream (I), and warble (J). The rasters and peristimulus time histograms are aligned relative to onset of the vocalization; the solid gray line indicates onset of the vocalization. The histograms were generated by binning spike times into 40-ms bins.

