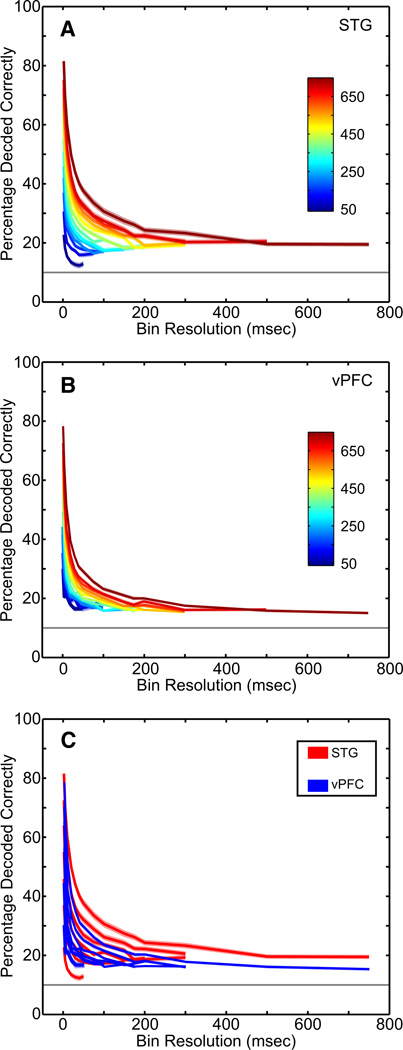
Fig. 5.
Decoding capacity of STG and vPFC neurons with a linear-pattern discriminator. A–C: the percentage of correctly decoded vocalizations as calculated from the linear-pattern discriminator. The percentage of correctly decoded vocalizations for the population of (A) STG neurons and (B) vPFC neurons as a function of the time interval following vocalization onset (in ms; see color legend) and the bin size (x-axis). The solid colored lines are the mean value and the shaded areas represent the SE. The solid gray horizontal line indicates chance performance (10%). C: the STG data (red) and the vPFC data (blue) are overlaid; to facilitate comparison, every other time interval has been removed.

