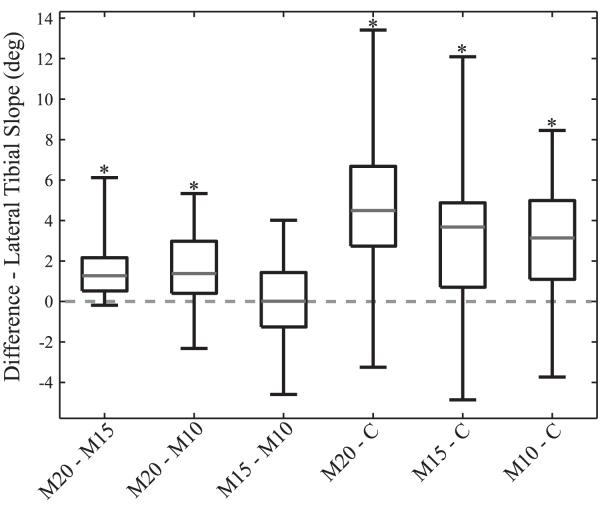
Figure 3.
The box plots compare the difference in lateral tibial slope measurements for 40 knees using the circle method (C) and the midpoint method with 20 cm (M20), 15 cm (M15), and 10 cm (M10) of proximal tibia. Central mark indicates the median value, edges of box indicate 25% and 75% quartiles, and the whiskers indicate the maximum and minimum values. In this figure, the asterisk denotes a significant difference at p < 0.005.

