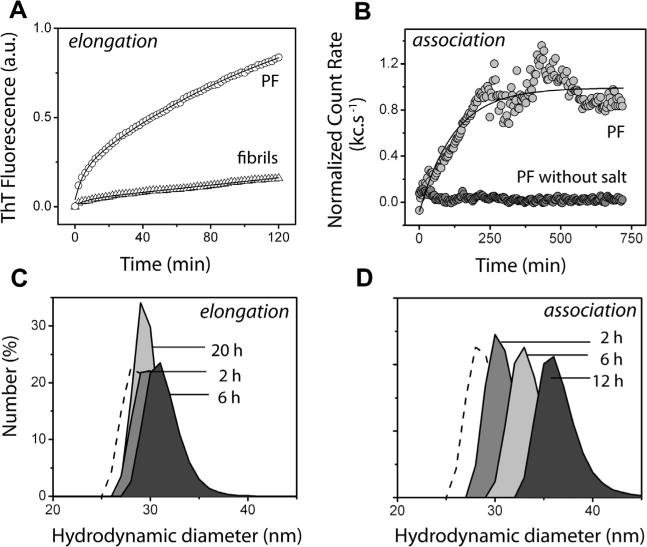
Fig. 2.
Elongation and association of Protofibrils (Ps). (A), Elongation of 2 μM Ps monitored over a period of two hours using ThT fluorescence in the presence of 25 μM Aβ42 monomers (circles). A similar reaction with 2 μM fibrils was used as negative control (triangles). (B), P association monitored over a period of 12 h using dynamic light scattering (DLS) in presence (light gray circles) and absence (gray circles) of 150 mM NaCl. The data is plotted against normalized count rates per second (Kcs–1). (C and D), Size distribution of Ps after 2, 6, and 20 h of elongation with 25 μM Aβ42 monomer and after 2, 6, and 12 h of association with 150 mM NaCl respectively, monitored using DLS.

