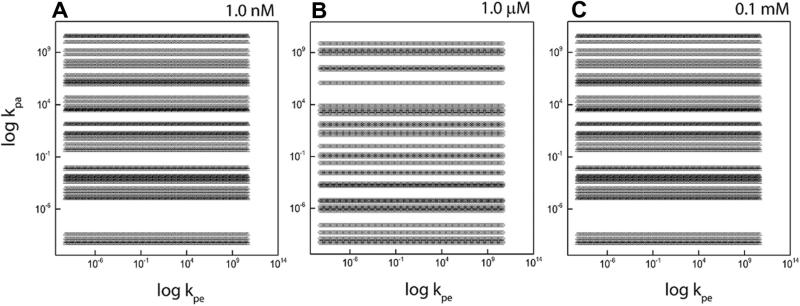
Fig. 4.
The figure shows the set of allowable rate constants based on the application of mathematical stability condition for the case γ1 = γ2 = 0.5 where all three stability constraints have been applied. The panels A, B and C show the variation of the graph with changing values of equilibrium concentrations Me and Pe.

