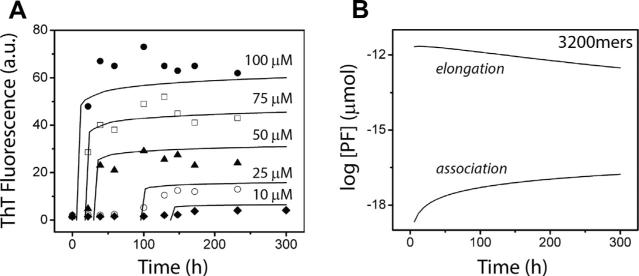
Fig. 7.
The figure shows the results of our numerical simulations of the system (1)–(4) with the rate constants derived from the stability criteria. Multiple curves for different initial conditions are shown in panel (A) and compared with experimental data taken from [7]. Panel (B) shows the individual elongation and association curves in semi-log form.

