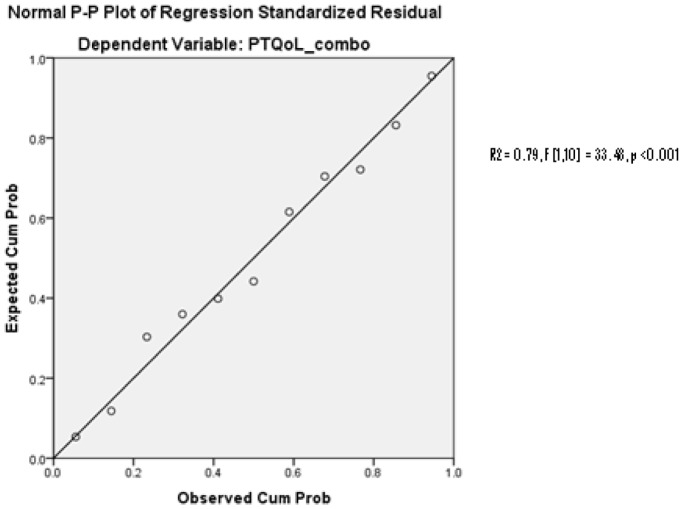
Figure 2. Regression Model, Self-Reported Depression and HRQoL.
Cumulative distribution functions (fit between probability distributions) of self-reported depression against self-reported HRQoL. The Probability-Probability (P-P) plot demarks the fit of probability distributions, The data presented are approximately linear, which suggests that the specified theoretical distribution was the correct model (e.g. a good fit between the specific distribution and the observed data).

