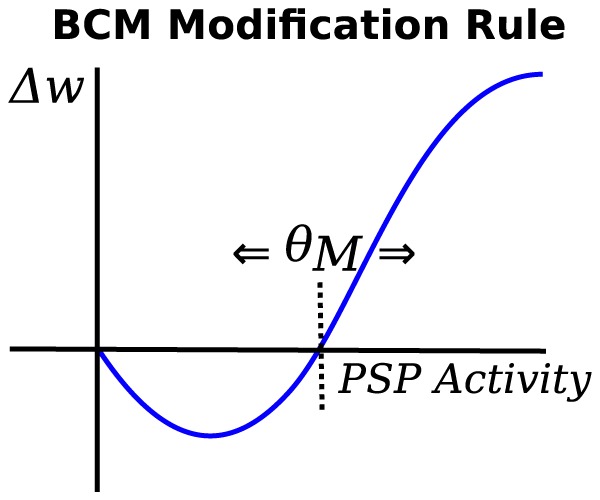
Figure 10. The Bienenstock-Cooper-Munro plasticity rule illustrated with synaptic weight change on the y-scale and post-synaptic activity on the x-scale.

 is the sliding modification threshold that changes based on a temporal average of post-synaptic activity.
