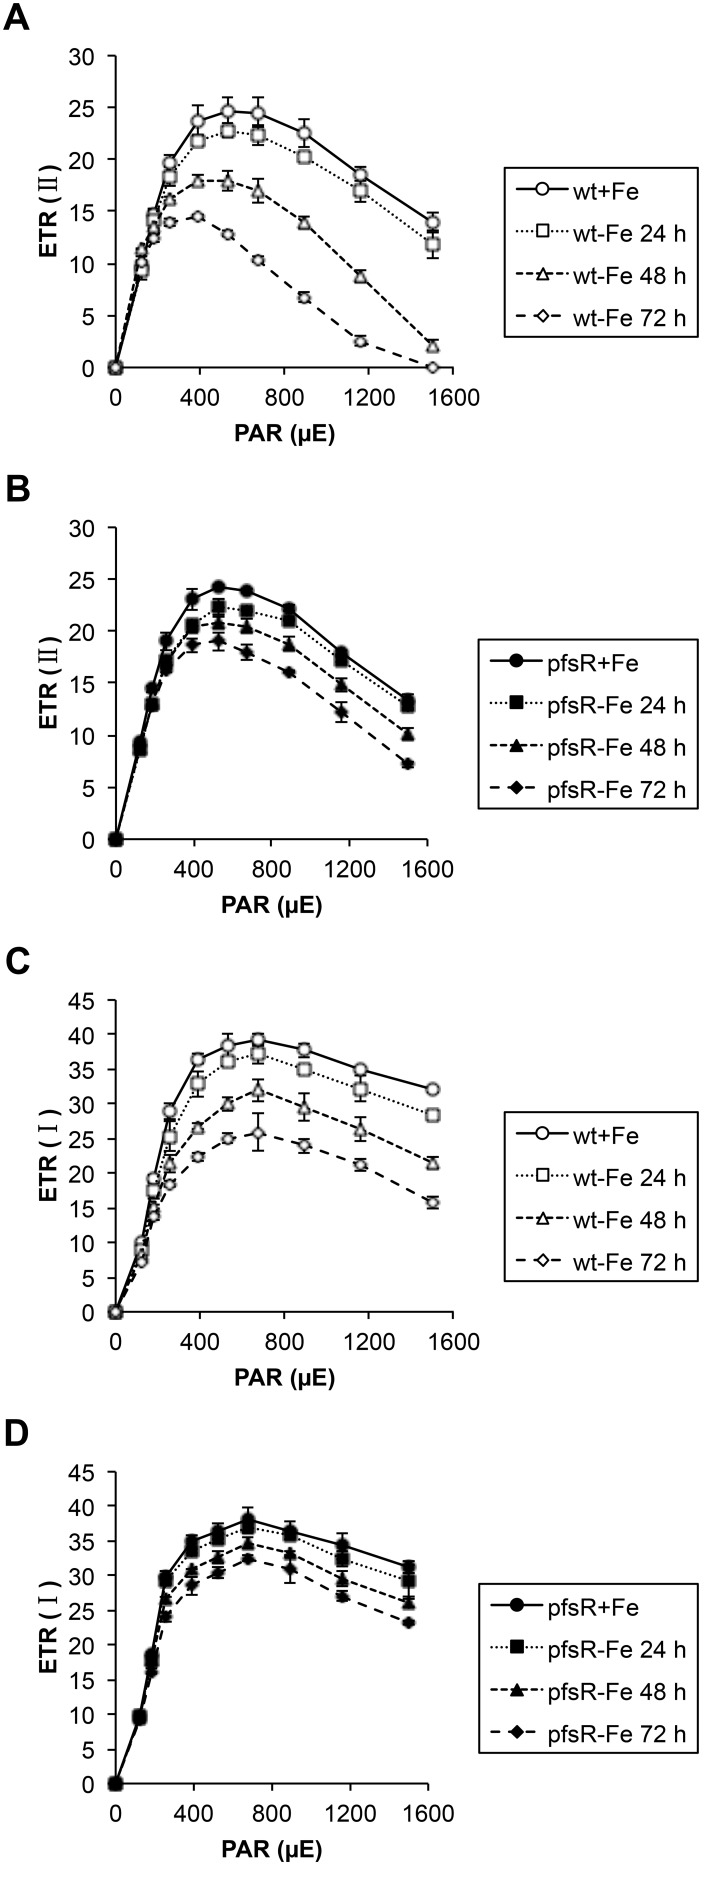
Figure 6. Light response curves of the wild type and the pfsR deletion mutant.
Wild-type (A and C, open symbols) and pfsR deletion mutant (B and D, closed symbols) cells were exposed to iron limitation for the indicated periods of time (0 h, circles; 24 h, squares; 48 h, triangles; 72 h, diamonds). The relative electron transport rate (ETR) of PSII [ETR (II)] and PSI [ETR (I)] were assessed base on chlorophyll fluorescence measurements at stepwise increasing PAR levels. The data are means±SD of six independent measurements.

