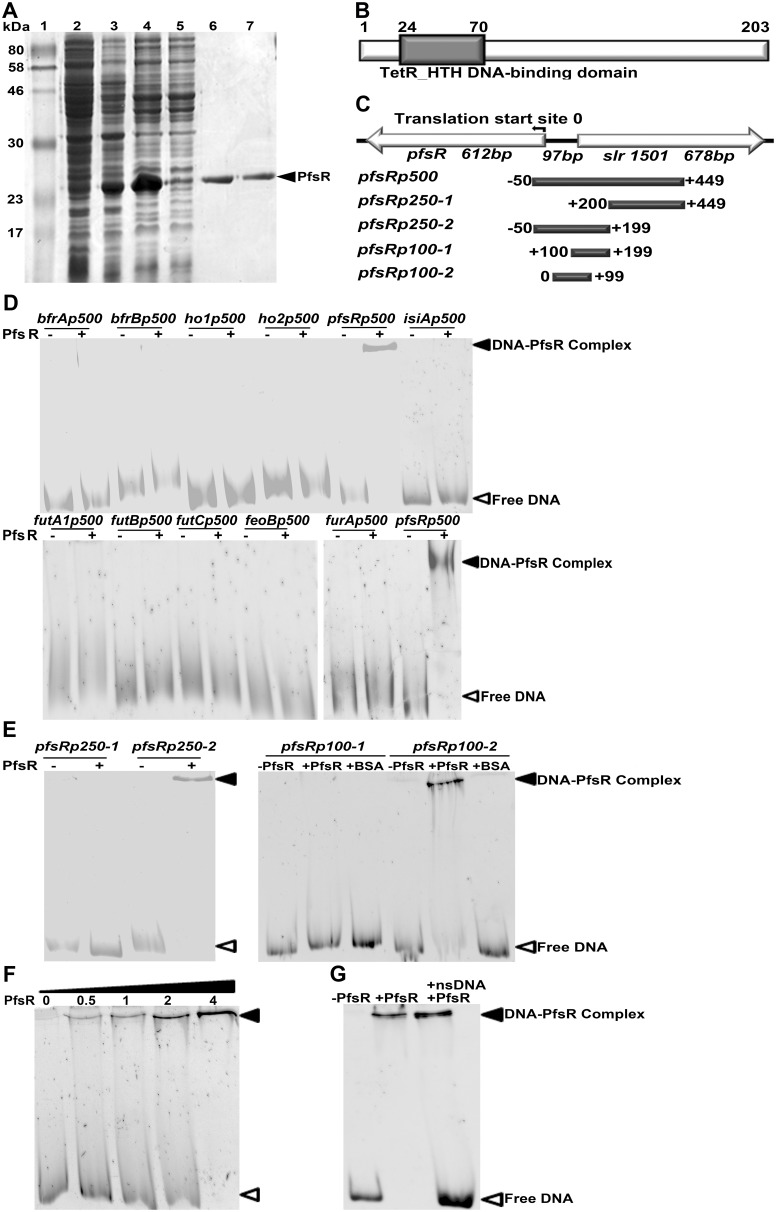
Figure 9. DNA-binding activity of PfsR.
A, The expression and purification of recombinant Synechocystis 6803 PfsR. Purification was carried out using TALON spin columns. Lane 1, molecular weight standards; Lane 2, total proteins of uninduced E. coli cells; Lane 3, total proteins of induced E. coli cells; Lane 4, soluble proteins of induced E. coli cells; Lane 5, proteins in flow through; Lane 6 and Lane 7, eluted PfsR. The molecular mass of the standards is shown on the left. Bands were visualized using Coomassie Blue staining. B, Analysis of the domain structure of PfsR. C, Schematic representation of the genomic location of pfsR and the location of DNA fragments used in the EMSA. D, EMSAs for the DNA-binding activity of PfsR with the promoter DNA fragments of futA1, futB, futC, feoB, bfrA, bfrB, ho1, ho2, pfsR, isiA, and furA genes. For these assays, 0.05 µM DNA fragments were co-incubated with 2 µM purified PfsR. E, EMSA to delimit the PfsR-binding region. EMSA was performed using 0.05 µM DNA fragments containing putative PfsR-binding regions and 2 µM purified PfsR or 10 µM BSA. F, Effect of increasing PfsR concentrations on binding to its own promoter. The assay was performed with 0, 0.5 µM, 1 µM, 2 µM, and 4 µM purified PfsR, respectively, and 0.05 µM pfsRp100-2 DNA. G, Competitive assay for the specific DNA-binding activity of PfsR. Binding of PfsR to pfsRp100-2 was competed with a 20-fold excess of non-specific DNA (nsDNA). The bands corresponding to free DNA and DNA-PfsR complexes are indicated by empty and filled triangles, respectively.

