
FIGURE 6.
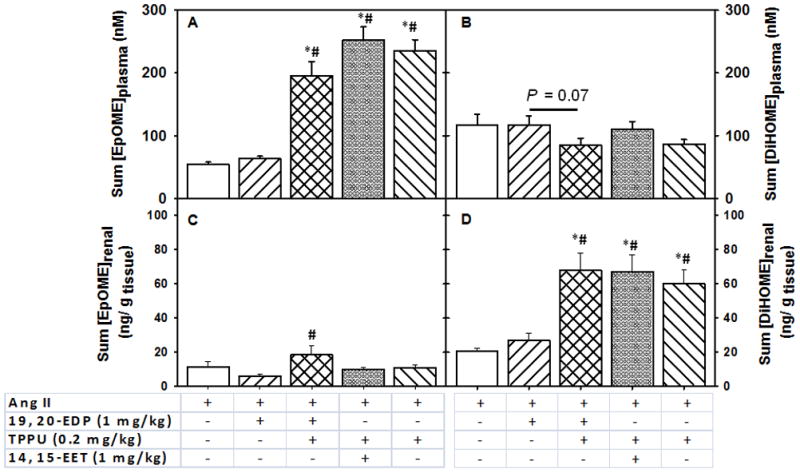
Changes in the summed linoleic acid P450 and sEH metabolites in the plasma and kidney upon subcutaneous infusion of EpFAs in angiotensin-II dependent hypertension. Summed EpOMEs include 9, 10- EpOME and 12, 13- EpOME, and summed DiHOMEs include 9, 10- DiHOME and 12, 13- DiHOME. Summed plasma concentrations of Panel A. EpOMEs, Panel B. DiHOMEs, and summed renal levels of Panel C. EpOMEs, Panel D. DiHOMEs. Statistically significant differences were analyzed by one-way ANOVA followed by pairwise comparisons. P < 0.05, *compared with Ang II animals, #compared with Ang II + 19, 20- EDP animals. Ang II, n=8; Ang II + 19, 20- EDP, n= 9; Ang II + 19, 20- EDP + TPPU, n=10; Ang II + 14, 15- EET + TPPU, n= 9; Ang II + TPPU, n= 9. Data are mean ± SEM.