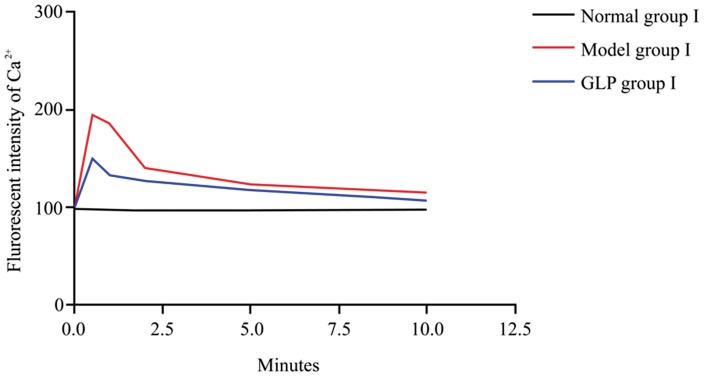
Figure 1. Changes in fluorescence intensity of Ca2+ in neurons during establishment of the model, n = 4, thirty neurons were observed in each replicate.
There is a significant increase (within 30 seconds) in fluorescence intensity of Ca2+ in neurons in the model group compared to the control group (p<0.001). This increase also occurs in the GLP I group, and it decreases in both Model and GLP I groups with time up to 10 minutes when the Model group is still significantly higher than the Control group I, but, there is no difference between the Control group I and GLP I groups at 10 minutes. Tukey’s test following one way ANOVA was used to perform statistical analysis.

