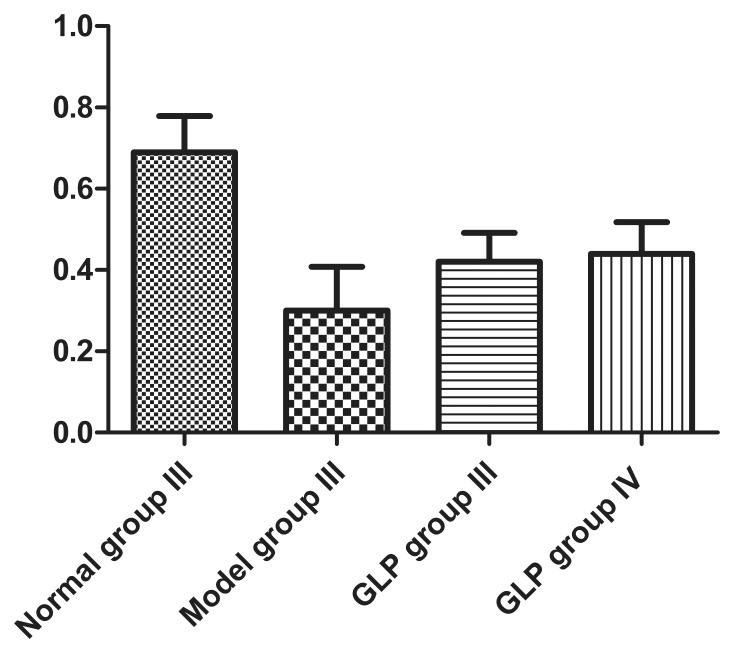
Figure 4. CaMK II α protein expression.
Relative amount of CaMK II αprotein expressed in neurons in different groups (A) and Western blot analysis (B) of neurons from each untreated/treated group. Data in figure 4A is shown as mean±SD, n = 4. Tukey’s test following one way ANOVA was used to perform the statistical analysis. #indicated p<0.01, compared to Control group III; *indicated p<0.01, compared to Model group III.

