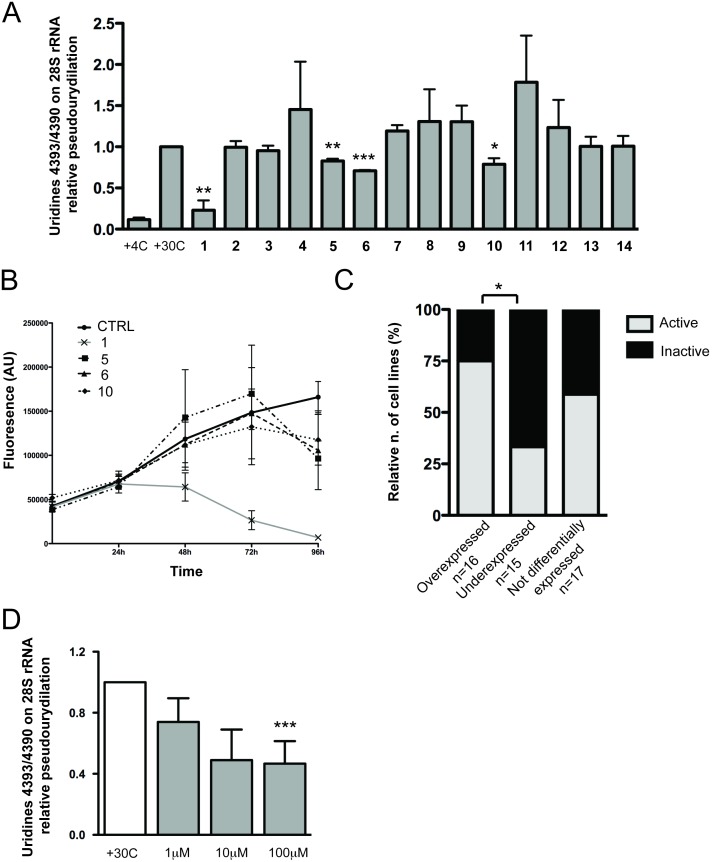
Figure 3. Effect of selected molecules on cellular pseudouridylation activity and viability.
(A) Bioactivity of the 14 selected compounds against pseudouridylation activity of human dyskerin in vitro. All the reactions were carried out at 30°C for 120 minutes with 100 µM of each compounds or DMSO. Histograms represent means and SEMs from three independent experiments. P values<0.05 are considered significant and are indicated with *(p<0.05), **(p<0.01) and ***(p<0.001). (B) Cytotoxicity of compounds 1, 5, 6 and 10 on MCF7 cell line. 100 µM of compound 1, 5, 6 and 10 were added to cell and Alamar Blue assay performed each 24 hours for 4 days. Means and SDs from three independent experiments are represented. (C) Correlation between the expression profiles of DKC1 gene and reported bioactivity experiments of pyrazofurin (compound 1). Cells lines are divided into three groups according to dyskerin expression: overexpressed, underexpressed and not differentially expressed. Histograms represent the percentage of the cell lines in each group sensitive to the pyrazofurin cytotoxic activity. * = p<0.05. P value<0.05 is considered significant. The P is not indicated where correlations between the groups are not significant. (D) Effect of treatment with compound 1 on MCF7 endogenous U4393/U4390 rRNA pseudouridylation. Cells were treated with 1 µM, 10 µM and 100 µM of compound 1 or DMSO for 24 hours. Histograms represent means and SEMs from three independent experiments. *** = p<0.001. P value<0.05 is considered significant.

