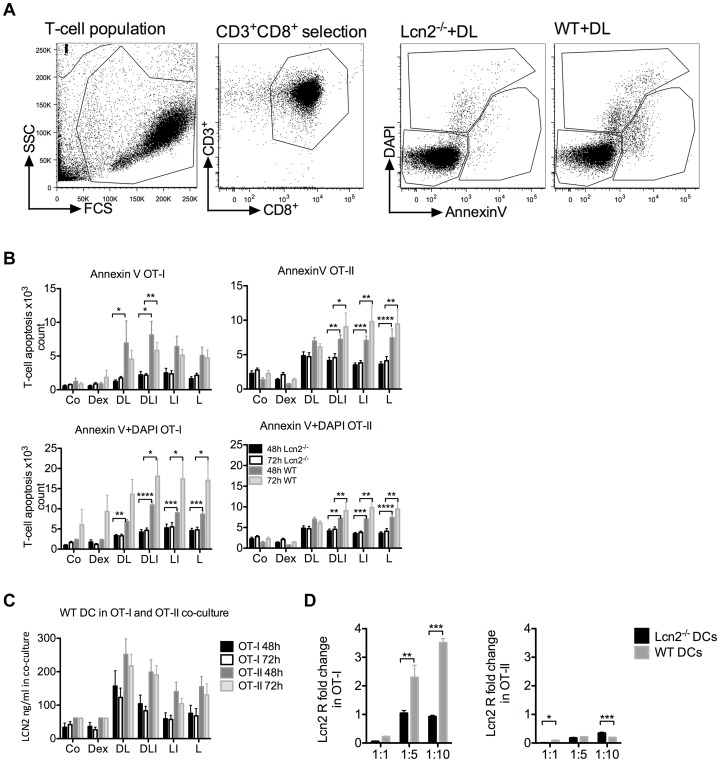
Figure 2. WT and Lcn2−/− DC/T-cell co-culture and analysis of CD8+ T-cell apoptosis.
T-cells were analysed after DC/T-cell co-culture by flow cytometry. WT and Lcn2−/− DCs were treated for 6 h with Dex, Dex+LPS (DL), Dex+LPS+IFN-γ (DLI), LPS+IFN-γ (LI), LPS alone (L) or on the left without any treatment (Co), and co-cultured with OT-I or OT-II T-cells for 48 and 72 h. (A) Gating strategy, FACS analysis was done with cells positive for CD3+CD8+ or CD3+CD4+ fluorescence and the output data were divided in 3 main groups: alive, Annexin V and DAPI to distinguish early and late apoptosis. (B) Early and late apoptosis of OT-I or OT-II T-cells after 48 and 72 h. OT-I T-cells, 1240, underwent early apoptosis in DL-treated Lcn2−/− DCs compared with WT DCs co-culture, 6920, p value <0.05. In the same condition, the comparison of 4829 and 6958 OT-II T-cells was not statistically relevant. Absolute cell numbers were determined with Trucount (BD). The two groups were analysed by ANOVA followed by Bonferroni correction for multiple comparison test (*p<0.05, **p<0.01, ***p<0.001, ****p<0.0001). P value refers to the comparison at 48 or 72 h. (C) LCN2 protein expression measured by ELISA in supernatant from treated WT DC/OT-I or treated WT DC/OT-II T-cell co-cultures after 48 and 72 h incubation. These data were pooled from 3 independent experiments performed in triplicate per OT condition and are shown as mean ± SEM. (D) Quantitative PCR (TaqMan) analysis of LCN2 receptor, Lcn2R (Slc22A17) expression in OT-I and OT-II T-cells after 72 h DC/T-cell co-cultures at 1∶1, 1∶5, 1∶10 ratio. Black bars represent T-cells co-cultured with 6 h-LPS-treated Lcn2−/− DCs, grey bars represent the co-culture with 6 h-LPS-treated WT DCs. The two groups were analysed by ANOVA. P value is *p<0.05, **p<0.01, ***p<0.001.

