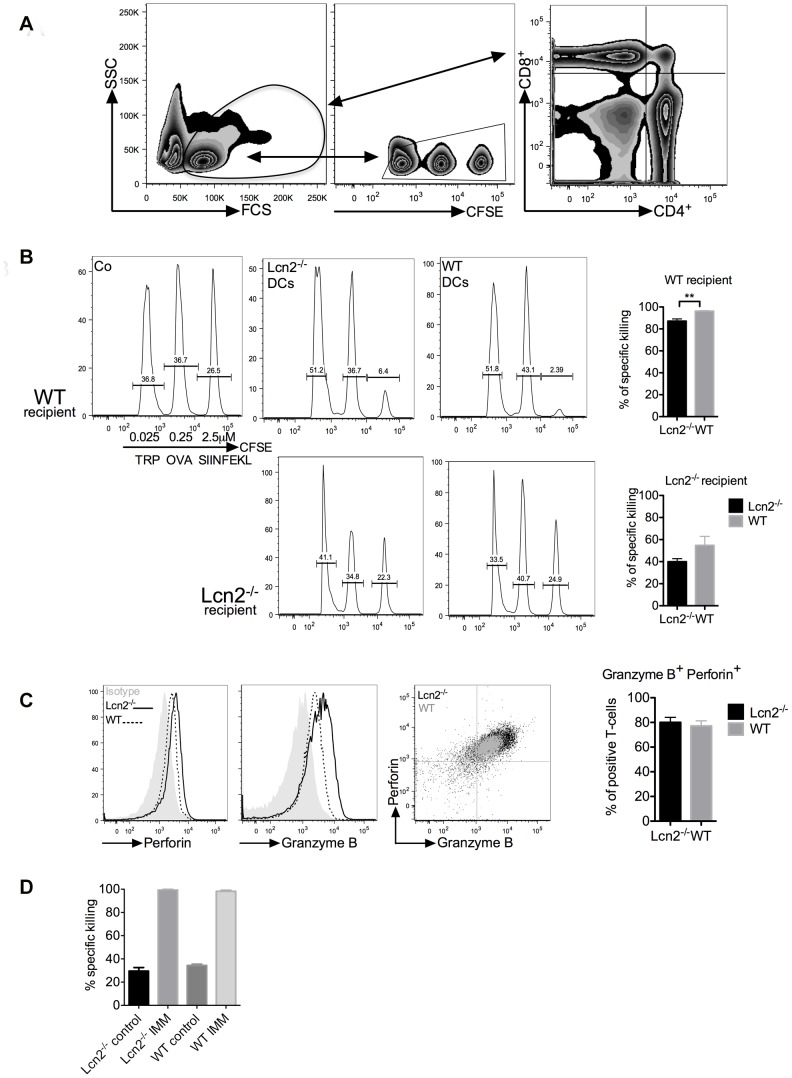
Figure 3. CTL assay with DC and peptide immunisation.
(A) Gating strategy of lymph nodes, splenocytes were selected for CFSE staining and analysed. On the right, CD8+ and CD4+ T-cells in lymph nodes. (B) Analysis of the splenocytes in immunised WT or Lcn2−/− recipient mice. Cells were selected based on the CFSE staining. On the left, the control group received just PBS, in the middle mice immunised with 6 h-LPS-treated Lcn2−/− DCs and on the right, mice immunised with 6 h-LPS-treated WT DCs. Histograms show the specific killing effects using Lcn2−/− or WT DC immunisation. These data show the most representative of pooled mice (5 mice/group) performed 3 independent times and shown as mean ± SEM, p value is **p<0.01. (C) FACS analysis of perforin and granzyme B intracellular staining in OT-I cells after 72 h of WT or Lcn2−/− DC/T-cell co-culture. DCs were pre-treated for 6 h with LPS. Histograms show the percentage of positive cells in the co-culture. (D) Comparison of in vivo CTL assays in WT and Lcn2−/− recipient mice immunized with SIINFEKL257–264 and CpG peptides for 7 days. These data show the most representative experiment of pooled mice (5 mice/group) performed 3 independent times.

