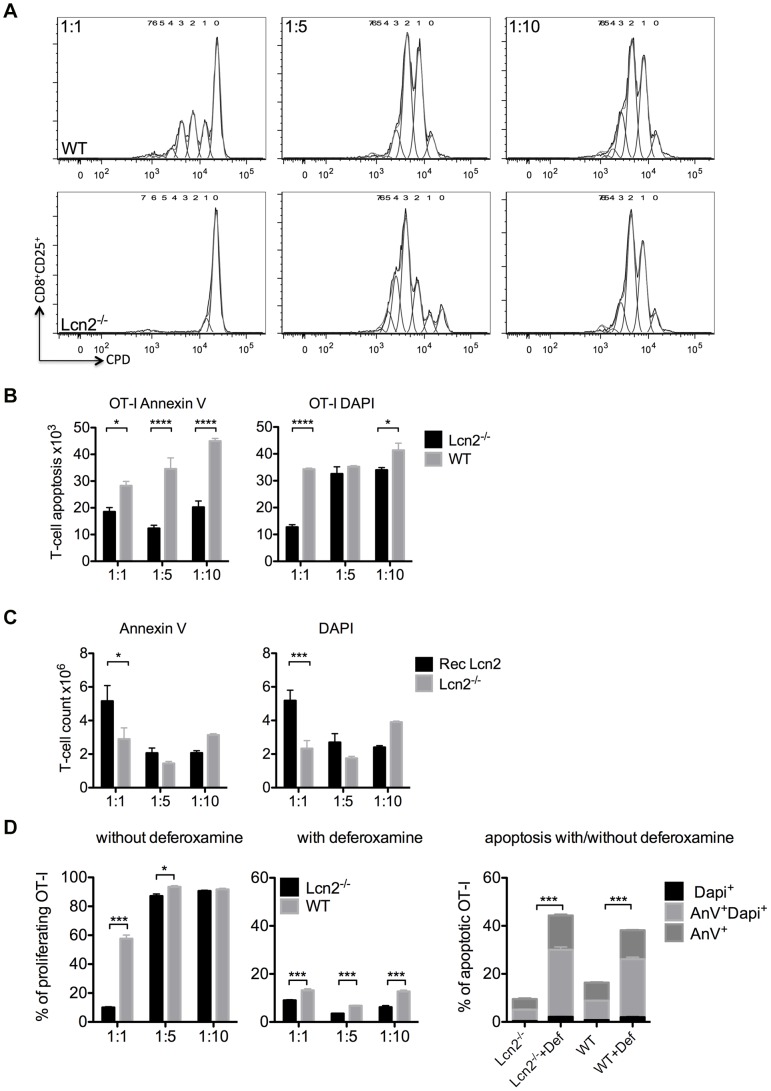
Figure 4. T-cell priming in DC/T-cell co-culture. WT and Lcn2−/− DCs were pre-treated for 6 h with LPS and then co-cultured with T-cells.
The extent of proliferation was calculated after 72-culture from the decrease in fluorescence per cell of the cell proliferation dye (CPD). (A) Histograms represent CD8+ T-cell divisions. Activated T-cells were stained and gated on cells positive for CD8+CD25+. Generation 0 was the undivided population initially labelled with CPD and all other generations were the result of the sequentially halved CPD fluorescence. The results were analysed by the proliferation tool of FlowJo. (B) Analysis of the T-cell apoptosis at 1∶1 (105∶105), 1∶5 (2×10⁴∶105) and 1∶10 (104∶105) DC/T-cell ratios. T-cells (OT-I) were co-cultured with 6 h-LPS-treated Lcn2−/− DCs (black bars) or 6 h-LPS-treated WT DCs (grey bars). Five independent experiments were performed in triplicate. Mean ± SEM, *p<0.05, ****p<0.0001. (C) Analysis of T-cell apoptosis after adding Recombinant Lcn2 (Rec Lcn2) in DC/T-cell co-culture. Lcn2−/− DCs, pre-treated with LPS for 6 h, were co-cultured 72 h with T-cells in medium supplemented with Rec Lcn2. Five independent experiments were performed in triplicate. Mean ± SEM, *p<0.05, ***p<0.001. (D) Proliferation and apoptosis of T-cells (OT-I) was determined after co-culture in the absence or presence of desferrioxamine (1∶1, 1∶5 and 1∶10 ratio) for 72 h with DCs that had been previously incubated for 6 h with LPS. The two groups were analysed by ANOVA and shown as mean ± SEM, *p<0.05, ***p<0.001.

