
Figure 4. Expression of FGFR1 is increased in Caco2-SOX2 compared to Caco2.
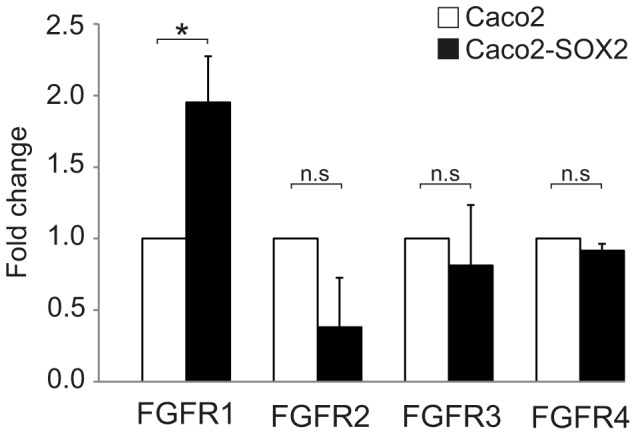
Expression of FGFR1, FGFR2, FGFR3 and FGFR4 by RT-PCR analysis in Caco2 cells and Caco2 cells stably overexpressing SOX2 (Caco2-SOX2). The expression in Caco2 was set as 1. *p<0.05, n.s: non-significant p-value.