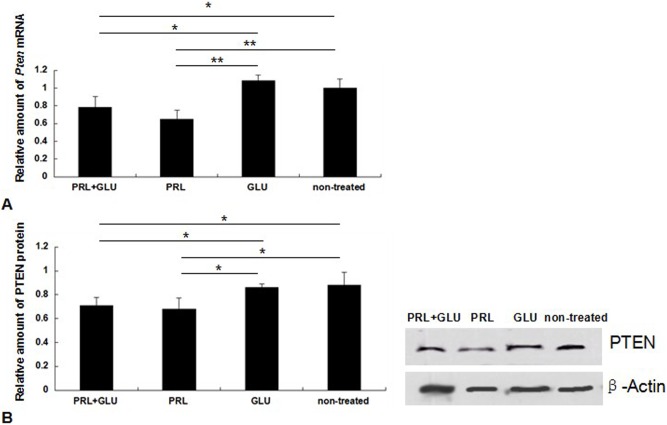
Figure 7. PRL and glucose influence on Pten expression.
(A) Analysis of Pten mRNA expression levels by qPCR. (B) Western blotting detection of PTEN. PRL+GLU, 12 mM PRL and 20 mM glucose for 24 h; PRL, 12 mM PRL for 24 h; GLU, 20 mM glucose for 24 h; non-treated, serum-free medium without supplements for 24 h. Expression is shown relative to β-Actin expression. *P<0.05, **P<0.01.

