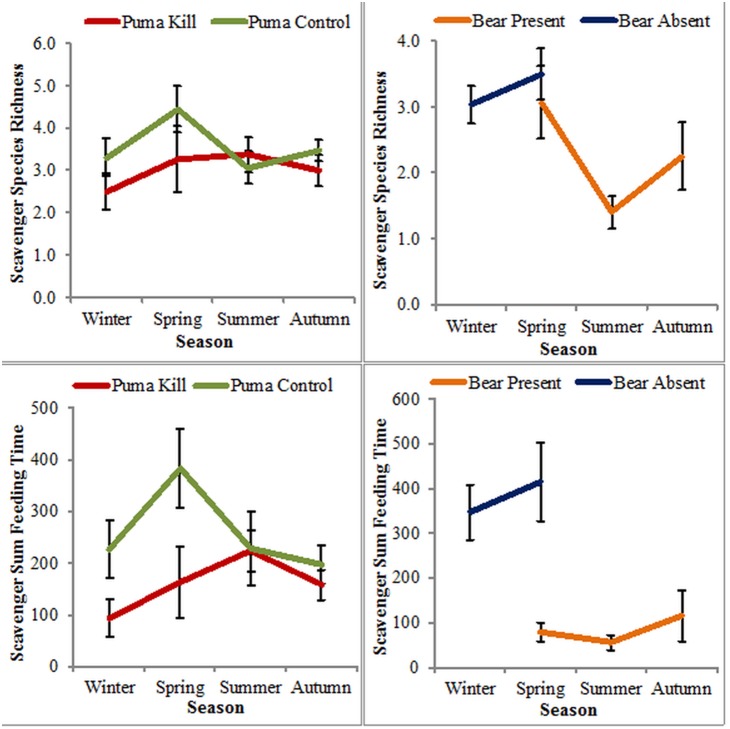
Figure 3. The seasonal distribution of scavenger species richness (number of scavengers present) and sum feeding time in minutes (total time scavengers spent feeding).
Each season is represented as a mean with the error bars representing standard error. We did not include samples on the graphs where there were <3 samples for a season.

