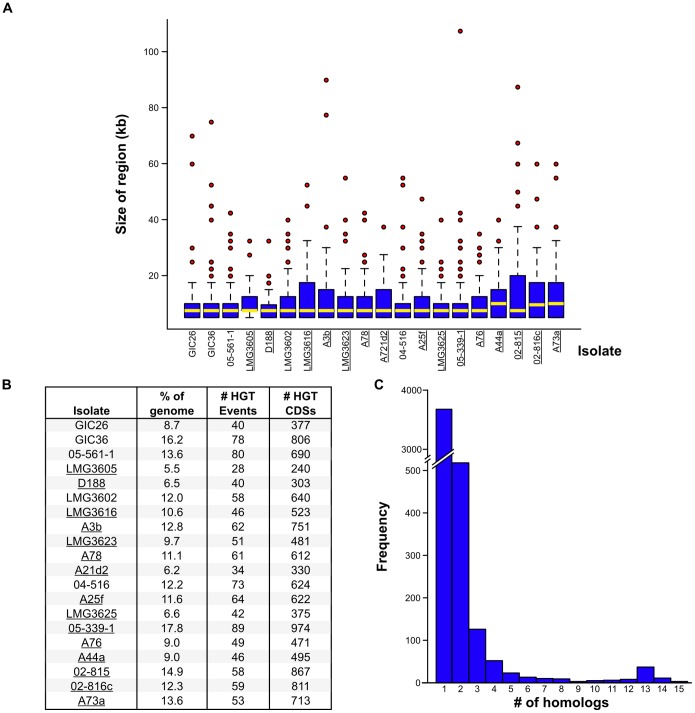
Figure 4. The scale of horizontal gene transfer varies among isolates.
(A) Box-and-Whisker plots of regions acquired by HGT as a factor of size. Regions putatively acquired via HGT were identified using Alien Hunter, with minimum criteria of size ≥5 kb and minimum score ranging from 10.297 to 16.047. Bottom and top of the boxes indicate the first and third quartiles, respectively, with the yellow bar indicating the median. Whiskers delimit the lowest and highest data within 1.5 interquartile ranges of the lowest and highest quartiles, respectively. Red circles represent outliers. Pathogenic isolates are underlined. (B) Summary statistics of HGT for the sequenced isolates. Pathogenic isolates are underlined. (C) Histogram presenting the number of groups of CDSs as a factor of group size. All CDSs identified in regions putatively acquired by HGT were compared using BLAST analysis to determine groups of homologs. The numbers of groups of CDSs (y-axis) were enumerated and plotted according to the size of the groups (x-axis). Analysis was done for only the 15 phytopathogenic isolates.

