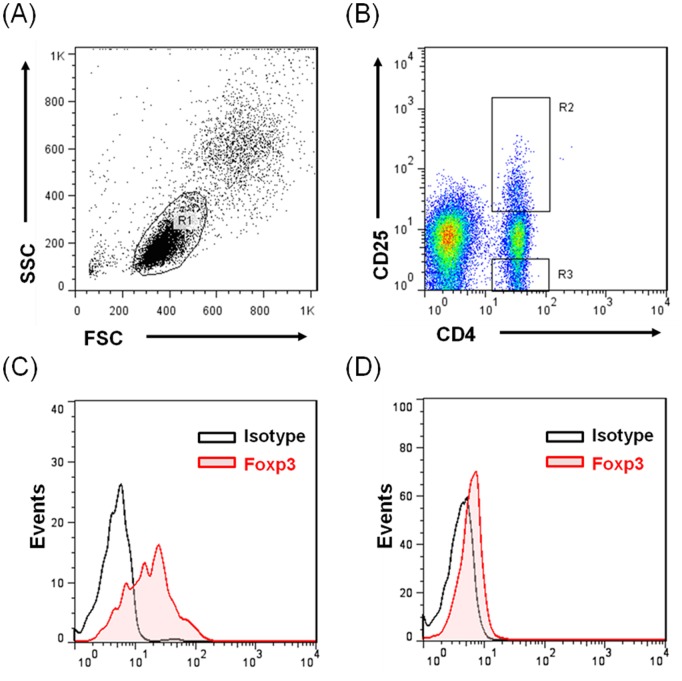
Figure 1. Representative plot illustrating gating strategy.
(A) Lymphocytes were gated according to forward and side scatter (R1), (B) CD4+CD25+ lymphocytes (R2), CD4+CD25− lymphocytes (R3). From the gated lymphocyte population, the total Foxp3 expression and isotype control were analyzed (C) (R2) and (D) (R3).

