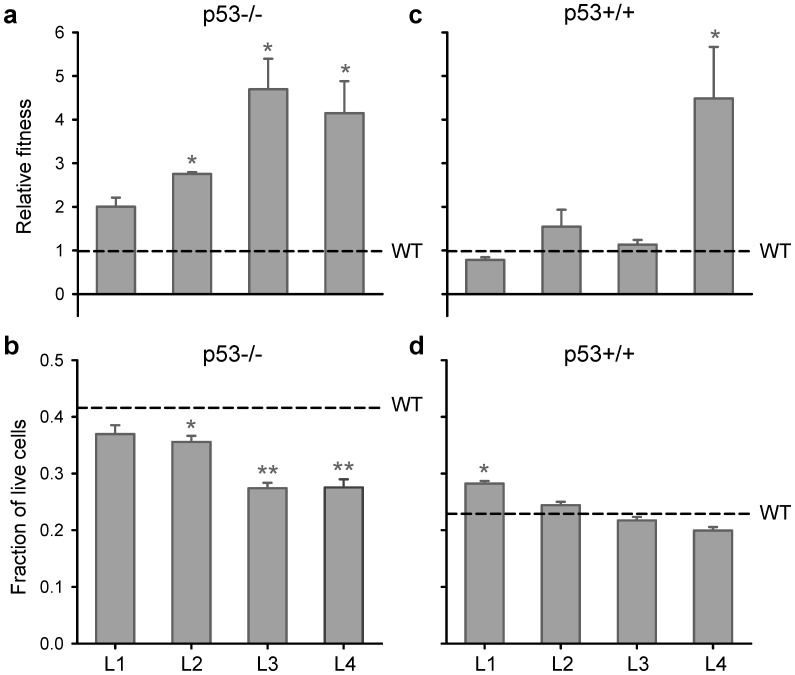
Figure 1. Evolution of viral fitness and cytotoxicity in MEFs.
VSV was evolved in p53−/− MEFs for 40 serial passages (MOI = 0.05) and, for each evolved lineage (L1–L4), fitness and cytotoxicity were assayed in p53−/− MEFs (a, b) as well as in isogenic p53+/+ MEFs (c, d). Fitness was determined in four independent competition assays (24 hpi) at a 1∶1 input ratio against a common competitor isogenic to the WT. Cytotoxicity was calculated as the fraction of live cells at 18 hpi relative to uninfected cultures using the MTS assay. For each line, changes in viral fitness and cytotoxicity were evaluated using a one-sample t-test against the WT value (*: P<0.05). The horizontal dashed lines indicate WT values, and error bars indicate the SEM.

