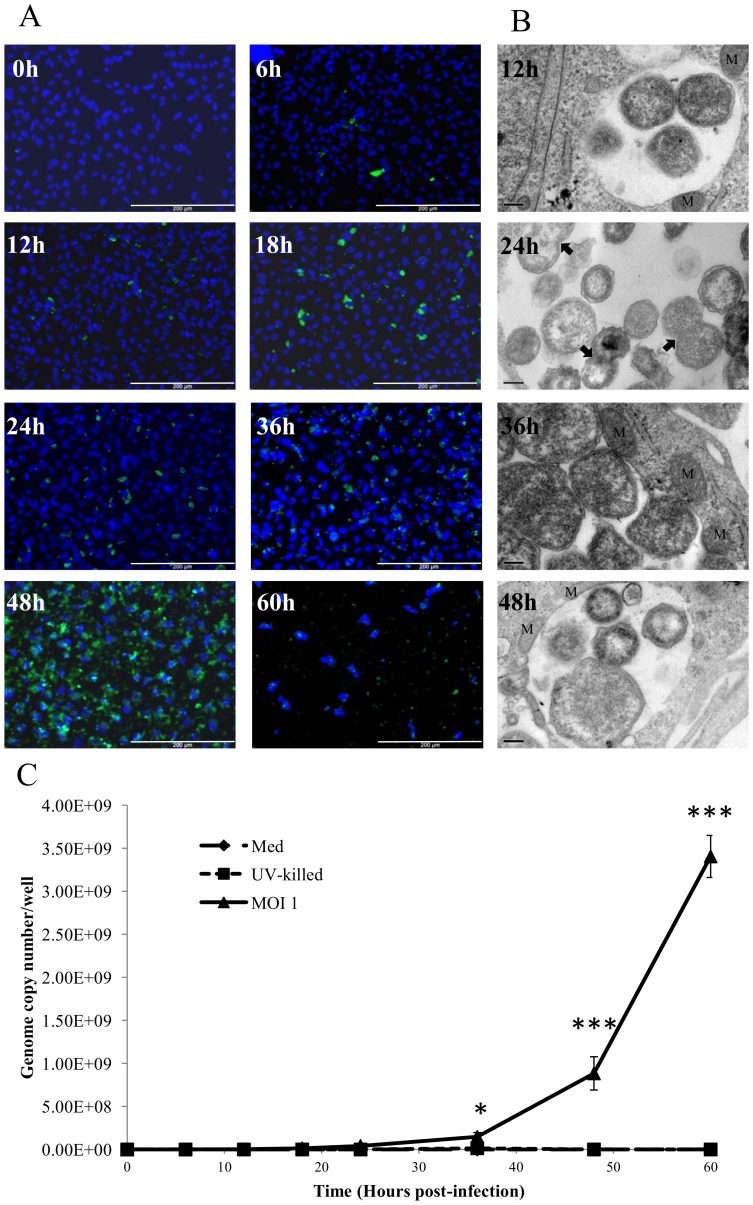
Figure 2. Bacterial growth within AH-1 trophoblast cells.
A) Growth of W. chondrophila in AH-1 cells assessed by fluorescence microscopy. W. chondrophila inclusions are labelled green using an anti-Waddlia rabbit polyclonal antisera and FITC anti-rabbit secondary antibody, host cell nuclei are stained blue (Dapi). The scale bars correspond to 200 µm. B) Transmission electron micrographs at various specified time-points post-infection, demonstrating RB dividing by binary fission (24 h panel indicated by the arrows) and mitochondria associated with the inclusion (12 h, 36 h and 48 h panels indicated by M) and multiple forms of the organism (48 h panel) as the RBs condense to EBs. C) Quantitation of W. chondrophila growth by qPCR for 60 h post-infection. AH-1 cells were exposed to live W. chondrophila (MOI 1), UV- killed organisms (UV-killed) or medium alone (Med) and DNA isolated at the indicated time-points over the 60 h time-course. Statistically-significant differences relative to initial genome copy numbers at 0 h post-infection are indicated by *P<0.05; ***P<0.001 Data were analysed by two-way ANOVA. Comparisons between individual treatments were made using Tukey's multiple comparison test (n = 3).

