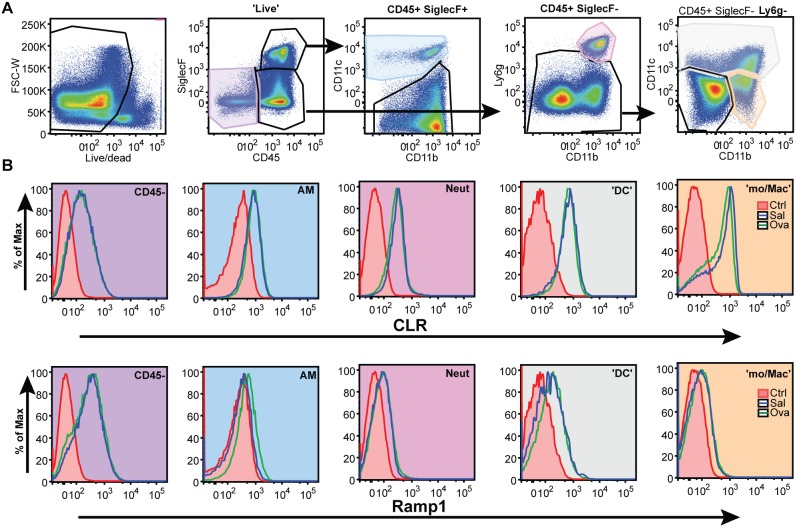
Figure 6. Expression of RAMP1 and CLR in lung tissue.
A. Flow cytometry gating strategy to determine cell populations within the lung. Arrows highlight the parent population being defined. B. Representative histograms showing the surface expression of CLR and RAMP1 in saline (blue line; n = 2) and OVA challenged (green line; n = 3) mice. The control in tinted red is a secondary only antibody stain. The fill of the histogram box correlates with the colored population in the flow cytometry plots in A. AM = alveolar macrophage, Neut = neutrophil, ‘DC’ = dendritic cell, ‘mo/Mac’ = monocytes and monocyte-derived macrophage.

