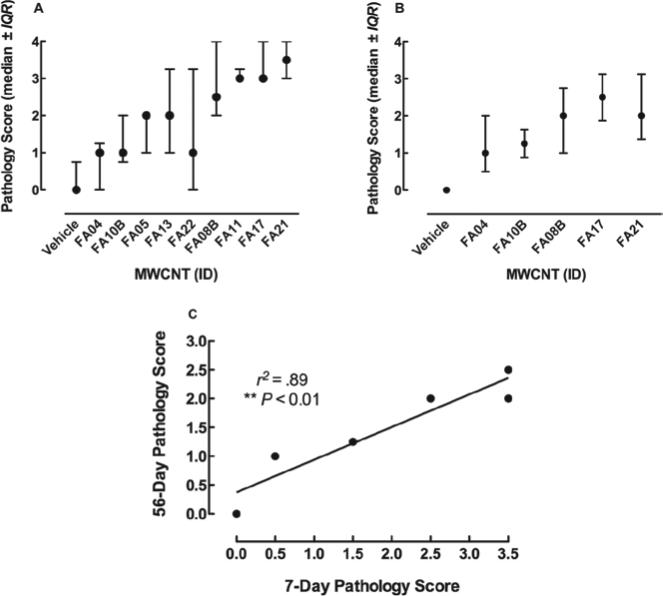
Figure 3.
Scatter-plots showing the distribution and variability of pathology scores. (A) Medan ± interquartile range for all pathology scores on scored day 7 samples arranged in order of increasing Ni contamination. (B) Median ± interquartile range for all pathology scores on scored day 56 samples arranged in order of increasing Ni contamination. (C) Correlation between 7- and 56-day scores. The pathology scores after 56 days were obtained by the same two scorers, and the same statistical analyses were conducted as the 7-day scores in Figure 2. Overall, the 56-day scores were generally lower, but there was a significant correlation between the two time points. **p < 0.01.

