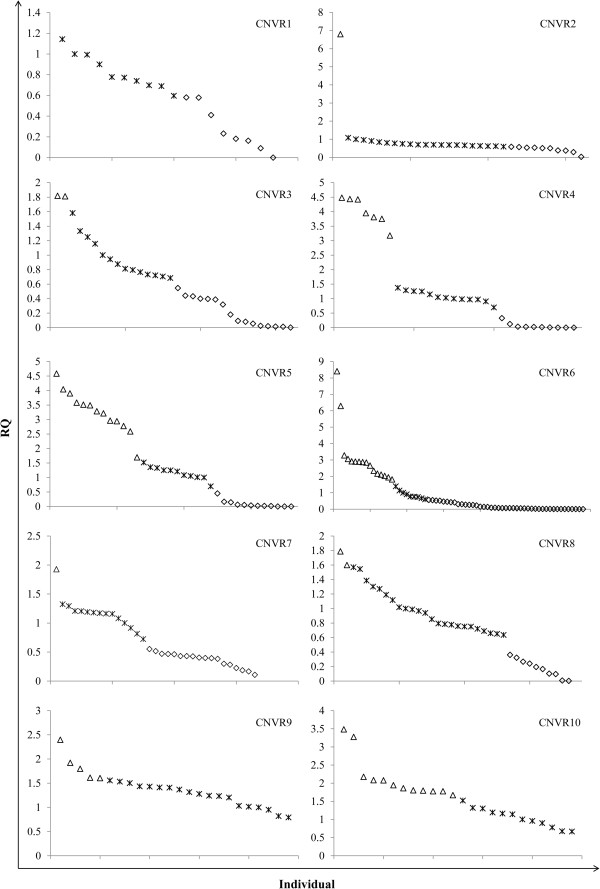
Figure 2.

Verification of 10 detected CNVRs by qPCR. CNVR1-10 represents 10 CNVRs selected for qPCR validation. X-axis shows the individuals used in the validation experiment. Y-axis shows the relative quantification (RQ) values obtained by qPCR. Different shapes denote samples with different RQ values. Asterisk: samples with RQ values about 1 denote normal individuals (two copies); Box: samples with RQ values below 0.59 (ln1.5) denote copy number loss individuals; Triangle: samples with RQ values about 1.59 (ln3) or more denote copy number gain individuals (>three copies) [61].
