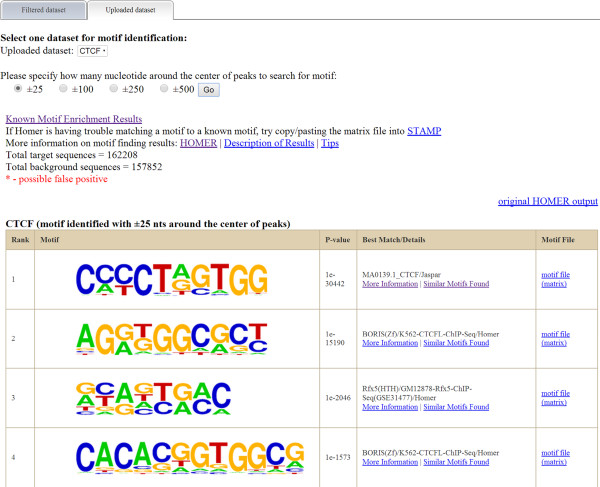
Figure 7.

Motif identification result for binding site of CTCF. Here is the result of motif enrichment analysis for ±25 bp around the center of CTCF binding sites. The identified motifs are sorted according to their p-values. Clicking on “more information” will display the details for that enriched motif. The original HOMER prediction result is available from the hyperlink provided above the table.
