
Fig. 2.
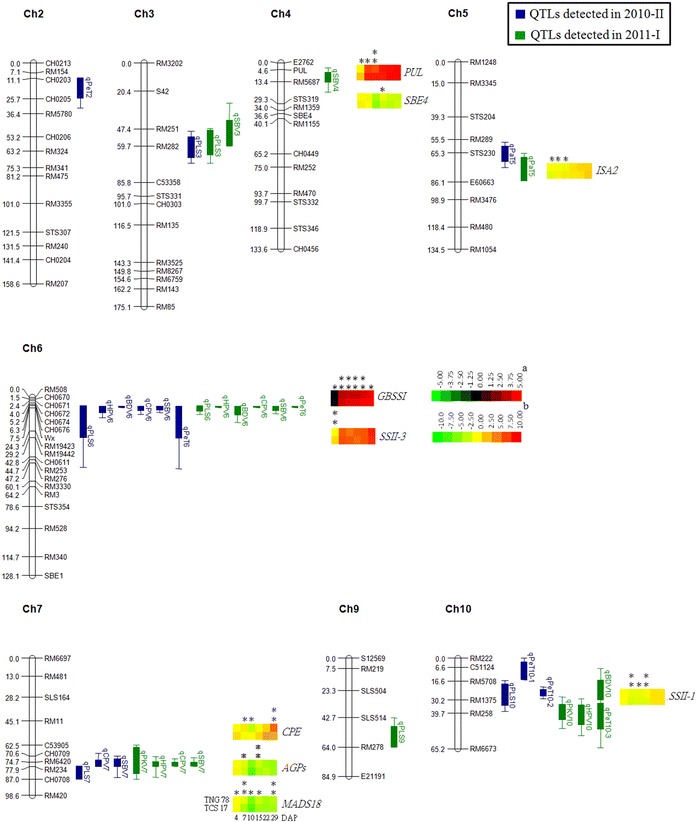
Interval maps of quantitative trait loci (QTLs) conferring eight physicochemical properties related to grain quality and gene expression of the candidate genes corresponding to the QTLs identified in this study. QTL intervals labeled with bars and lines extending out from the bar indicate 90 and 99 % likelihood, and QTLs identified in the second and first cropping seasons of 2010 and 2011 are labeled blue and green, respectively. The heat maps represent the gene expression of candidate genes residing in the identified QTL intervals analyzed in immature seeds harvested at 4, 7, 10, 15, 22, and 29 days after pollination subjected to real-time PCR. Supercript a, b Scales of heat maps for granule-bound starch synthase-I (GBSSI) and the other genes, respectively. Two asterisks and one asterisk p < 0.05 and 0.01, respectively, between the two parents, TNG 78 and TCS 17, as analyzed by t test. PUL pullulanase; SBE4 starch branching enzyme genes; ISA2 isoamylase genes 2; SSII-3 starch synthesisII-3; GBSSI granule-bound starch synthase-I; CPE COBRA putative expressed protein; AGPs alpha-1,4-glucan-protein synthase; MADS18 MADS-box family gene; SSII-1 starch synthesisII-1. (Color figure online)