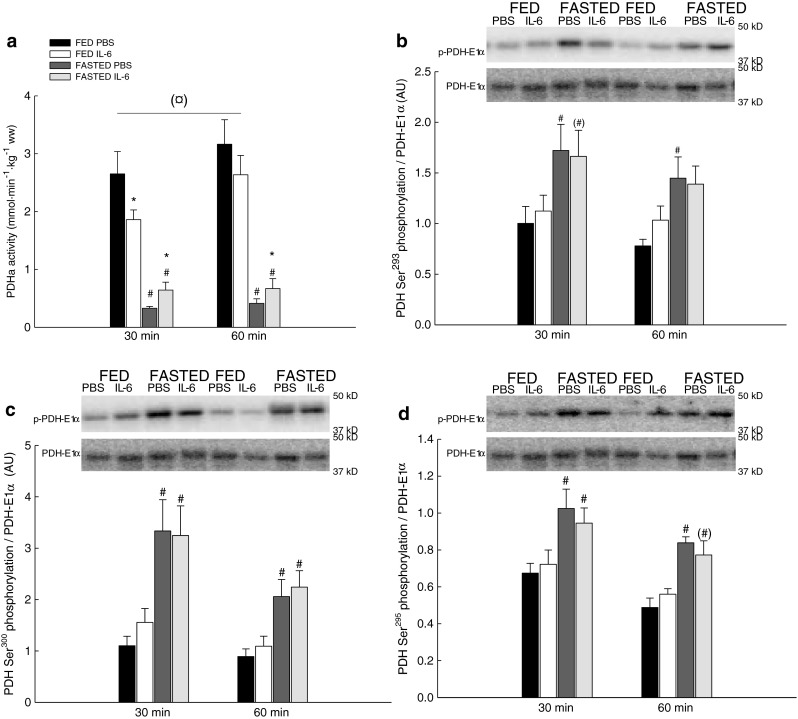
Fig. 6.

PDHa activity and phosphorylation of PDH. PDHa activity (millimoles per minute per kilogram) (a), PDH Ser293 phosphorylation (b), PDH Ser300 phosphorylation (c), and PDH Ser295 phosphorylation (d) in skeletal muscle of fed (FED) and fasted (FASTED) mice 30 and 60 min after a single injection of either PBS or rmIL-6. Values are means ± SE; n = 8. *P < 0.05, significantly different from PBS within given condition and time point; #P < 0.05, significantly different from FED within given treatment and time point; ¤0.05 ≤ P < 0.1, tendency for a difference between IL-6 and PBS. Symbols within parentheses indicate a statistical tendency 0.05 ≤ P < 0.1. Line indicates an overall effect
