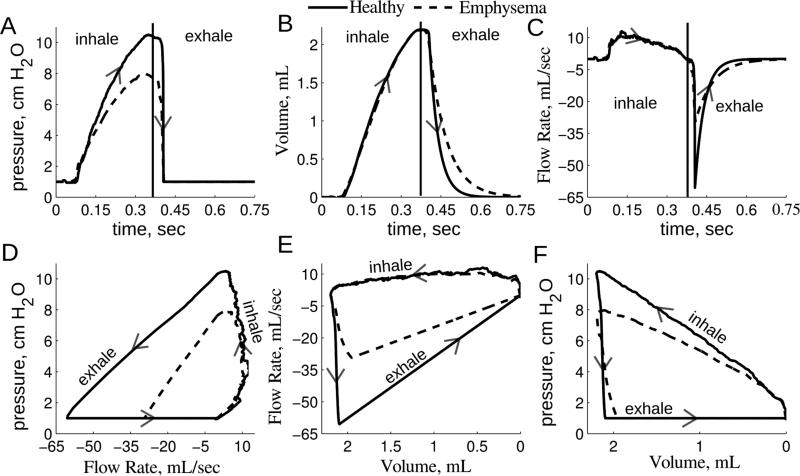
Figure 2.
Global 0D model solution for one healthy and emphysematous representative rat. Panel A: Experimental pressure tracing used to solve Eq. 2 and applied to the trachea face for the multiscale CFD simulations. Panels B and C: The 0D volume and flow rate solution. Panels D, E and F: The pressure and flow rate loops, flow rate and volume loops and pressure and volume loops. Arrows show the direction of the breathing cycle, beginning with inspiration.

