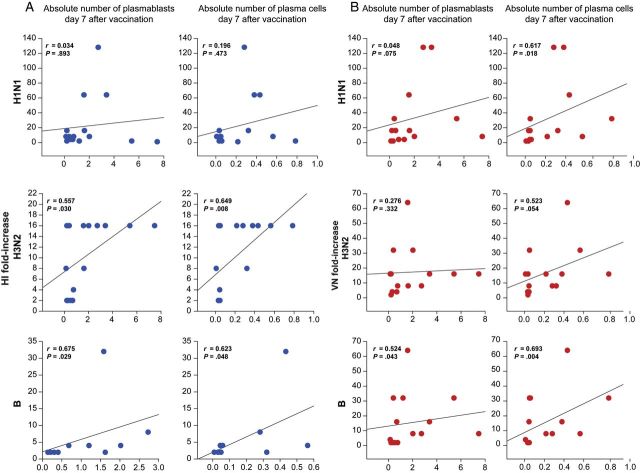
Figure 2.
Correlations between hemagglutination inhibition (HI) and viral neutralization (VN) titers and plasmablast and plasma B cells among trivalent inactivated influenza vaccine (TIV) vaccinees. A, Each plot represents the correlation between absolute numbers of plasmablasts and plasma B cells 7 days after vaccination with TIV and fold-increases of H1N1, H3N2, and B HI titers from day 0 (ie, baseline) to day 30 after vaccination. B, Each plot represents the correlation between absolute numbers of plasmablasts and plasma B cells 7 days after vaccination with TIV and fold-increases of H1N1, H3N2, and B VN titers from day 0 to day 30 after vaccination.

