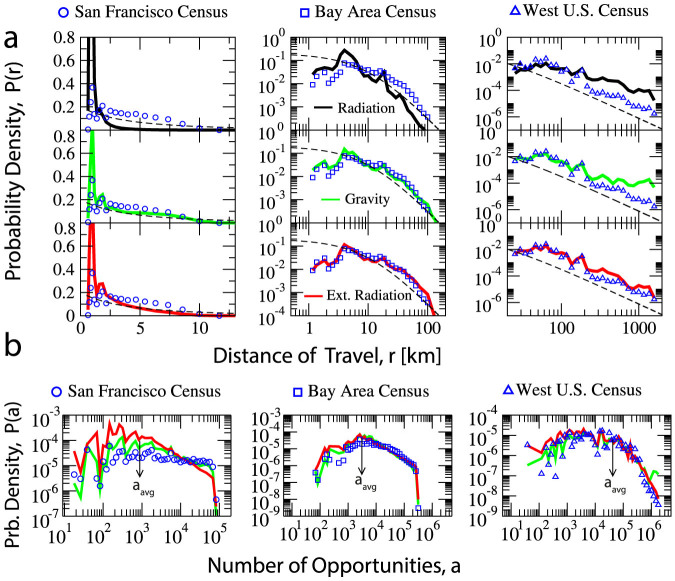
Figure 1. Comparison of the census data, the calibrated doubly constrained gravity model, the parameter-free radiation model, and the calibrated extended radiation model.
(a) The three columns represent San Francisco, the Bay area, and the Western U.S. respectively. The three rows are the results of the three different models compared with the census data. The radiation model gives relatively good prediction only at the Western U.S. scale. At the two smaller scales the radiation model under-estimates long distance trips. The doubly constrained gravity model gives close predictions to the census data at the three scales. The extended radiation model, with one parameter α, achieves the same prediction quality. The dashed line is a guide to the eye with the distance decaying function P(r) = 100(r + 10)−2.7. (b) The P(a) distribution, is the probability of measuring a commuting trip with a opportunities between the origin and the destination. Because the radiation model is not suitable for the two smaller scales, here only the extended radiation model and the doubly constrained gravity model are compared with the census data. The flat distribution of P(a) in the Census data within San Francisco differs from the other two scales, showing that the distribution of intra-city flows is influenced less by the number of opportunities between the origin and destination.

