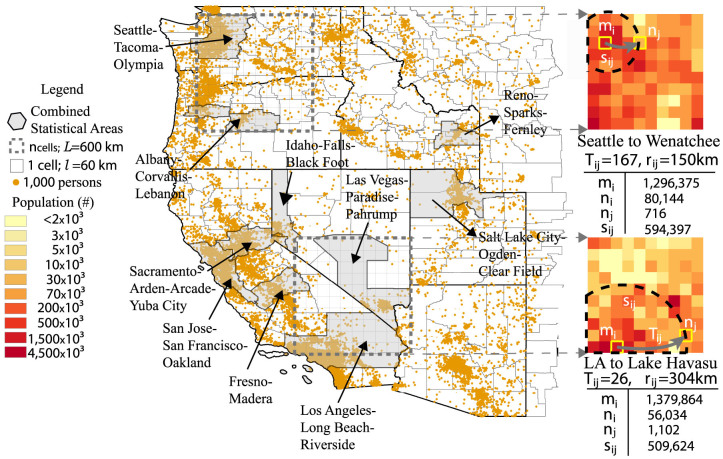
Figure 4. The influence of the opportunity homogeneity on the parameter α value.
The two grey rectangles are of the same scale: 600 km. The population distribution of the southern region has only two sharp peaks: Los Angeles and Las Vegas, while the population in the northern region is more homogeneously distributed. The right section of the figure shows one example OD pair in each region with similar mi, ni, nj and sij values. But the distance between Los Angeles and Lake Havasu City is much longer than the distance between Seattle and Wenetchee, which makes its commuting flow volume much smaller. This effect of distance is taken into consideration by the difference in the α value. For the southern region α = 5 while for the northern one α = 1.6. The grey regions are combined statistical areas which usually include one or more populated metropolitan areas.

