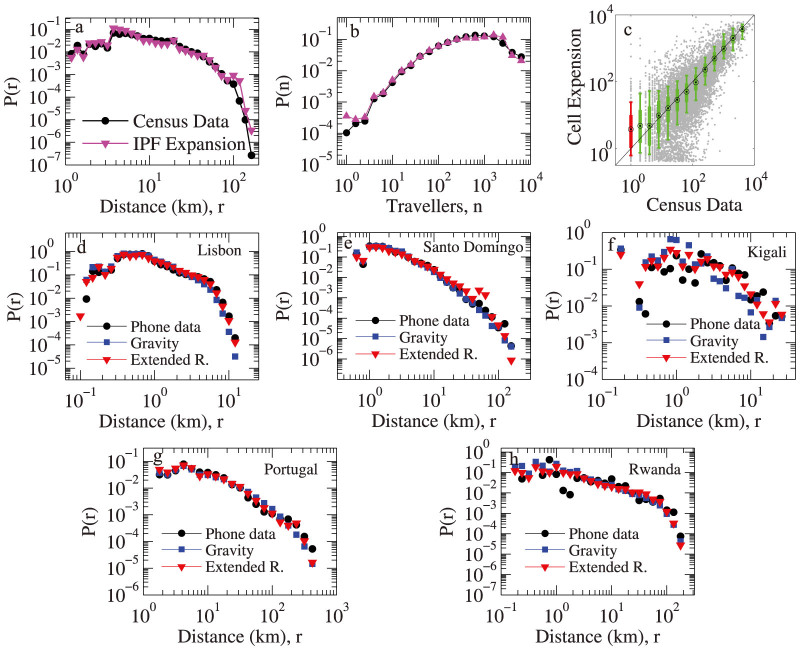
Figure 5. Validation of the IPF expression method and commuting patterns in different regions.
(a–c) The comparison of the distribution of commuting distance, the distribution of the number of commuters between O-D pairs, and the comparison of the census commuting flow Tij with the expanded cell phone users' commuting flow  . The close fitting in all three figures shows that we can recover the commuting patterns of the whole population from the seed matrix provided by the cell phone records. (d–h) Comparison of the distributions of commuting distance for Lisbon, Santo Domingo, Kigali, Portugal, and Rwanda. The extended radiation model can be successfully applied to all these cases and the corresponding α versus l relationship is marked in Fig. 3.

