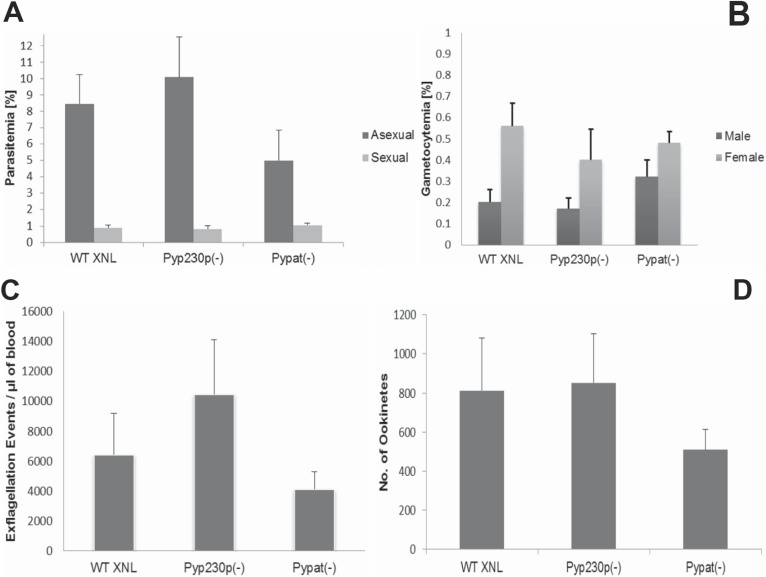
Figure 3. PAT deficient parasites do not show significant reduction in the development of sexual stages and ookinetes.
(A. and B.) Graphs are showing the average BS parasitemia (evaluated as percentage of infected erythrocytes) for asexual and sexual stages in (A), and the average ratio of male and female mature gametocytes in (B). In each experiment, groups of SW mice were IV injected three days earlier with 1 million BS parasites per mouse from each parasite genotype. All parasite genotypes were G5 transfers at the time of donor mice infection. (C.) Graph is showing average number of male gamete exflagellation events per μl of mouse blood determined by a hemocytometer using 1:10 dilution of tail blood. (D.) Graph is showing the average number of ookinetes dissected out of mosquitos infected with each of the three genotypes 20 hours pmf. The median values for all three genotypes were analyzed with the one-way Analysis-of-Variance (ANOVA) and statistical significance was set at a P value of <0.05. The P values in all experiments shown here were >0.05.

