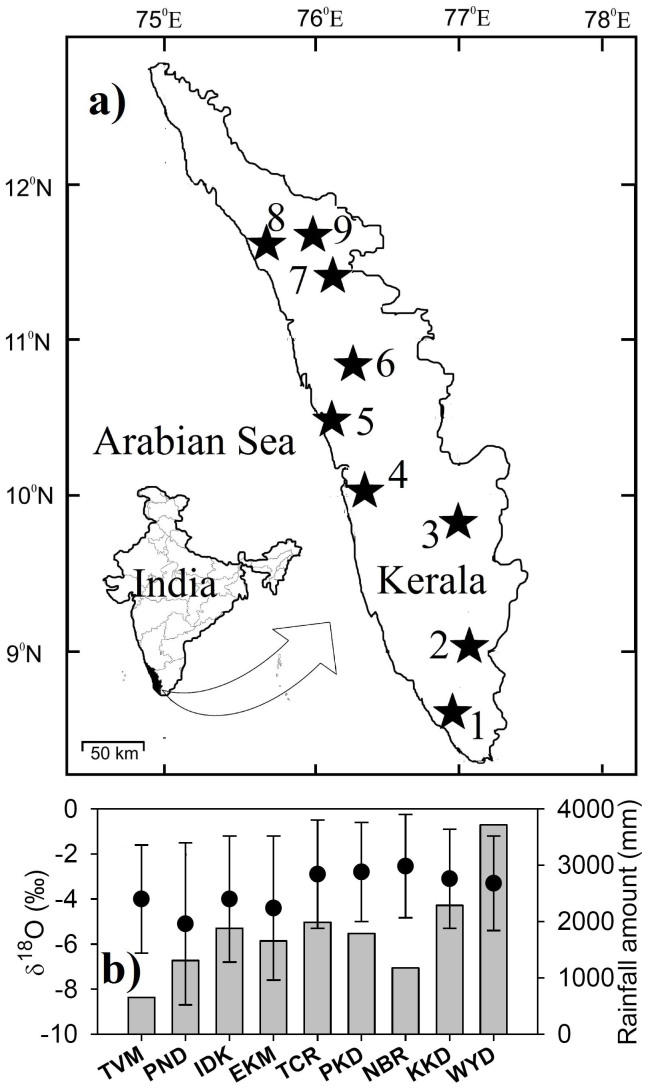
Figure 1. Sample locations and the amounts & δ18O of rain.
(a) Locations: 1- Thiruvananthapuram (TVM, 53 m asl), 2- Ponmudi (PND, 780 m asl), 3- Idukki (IDK, 700 m asl), 4- Ernakulam (EKM, 6 m asl), 5- Thrissur (TCR 12 m asl), 6- Palakkad (erstwhile Palghat) (PKD, 26 m asl), 7- Nilambur (NBR, 35 m asl), 8- Kozhikode (KKD, 30 m asl), 9- Wayanadu (WYD, 800 m asl), plotted using licensed CorelDRAW. (b) Total rainfall (mm, vertical bars) during Jun-Oct and the corresponding seasonal average δ18O (filled circles) with 1σ spread, over each station, plotted using licensed Sigma Plot.

