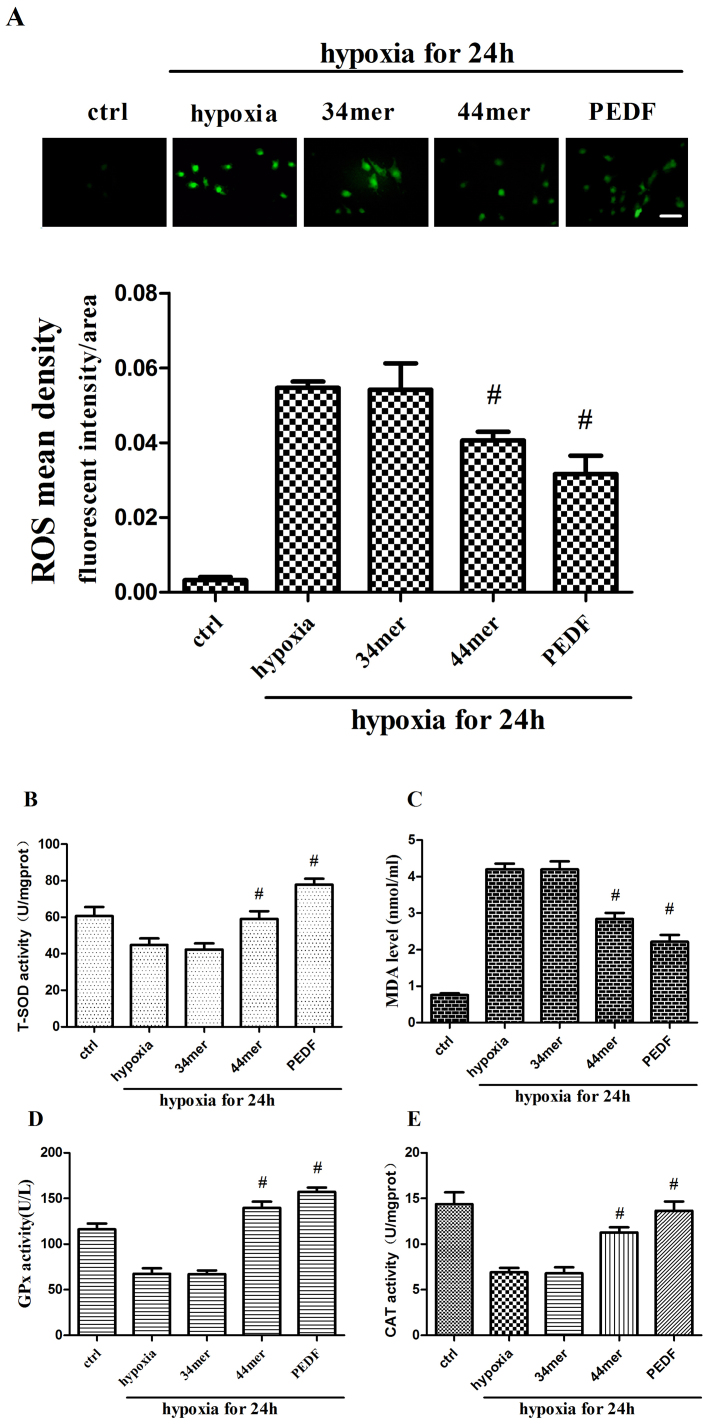
Figure 4. PEDF and 44mer reduced cellular ROS and MDA levels, increased SOD, GPx and CAT activities.
(a) ROS level was measured with DCFH-DA fluorescence probe method as described before and analyzed by Image-Pro Plus. Mean fluorescent intensity of ROS were decreased in PEDF and 44mer groups. (n = 6; #P < 0.05 compare to corresponding hypoxia group). (b) T-SOD activities were examined with xanthine oxidase method. T-SOD activities were increased in PEDF and 44mer groups. (n = 6; #P < 0.05 compare to corresponding hypoxia group). (c) MDA levels were examined with TBA method. MDA levels were decreased in PEDF and 44mer groups. (n = 6; #P < 0.05 compare to corresponding hypoxia group). (d) GPx activities were examined using ultraviolet spectrophotometric method. GPx activities were increased in PEDF and 44mer groups. (n = 6; #P < 0.05 compare to corresponding hypoxia group). (e) CAT activities were tested with colorimetric method. CAT activities were increased in PEDF and 44mer groups. Scale bar, 20 μm. Data are represented as means ± S E M.

