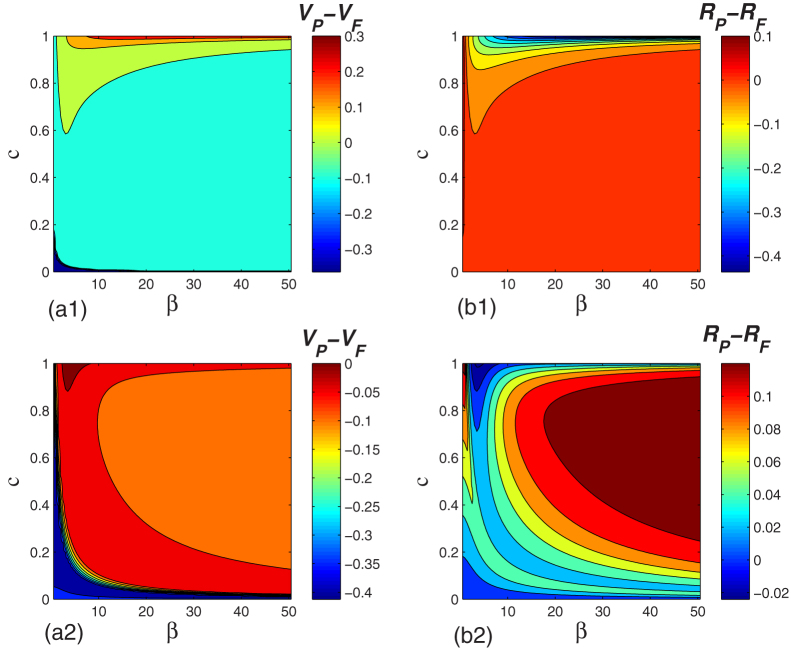
Figure 8. Comparison between the effects of free- and partial-subsidy policies in the parameter plane (β, c).
Left and right panels: differences in the vaccination coverage and epidemic size, VP − VF and RP − RF, respectively, in the β-c plane for δ = 0.1 (a1-b1) and δ = 0.7 (a2-b2). Other parameters are the same as for Fig. 1.

