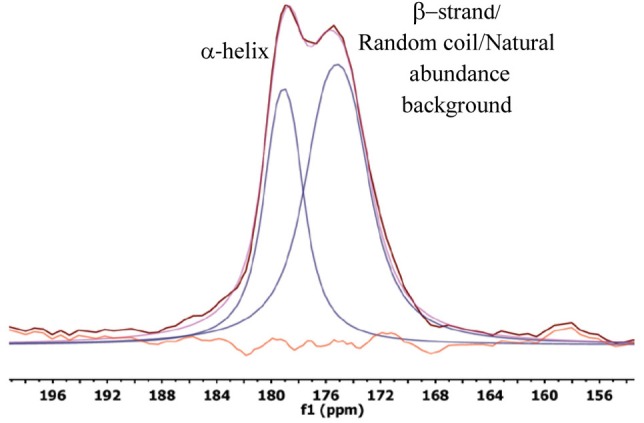
Figure 2.

One-dimensional 13C spectrum. Representative spectrum of LRAP-K24S28(+P) bound to HAP, in this case at an ionic strength of 0.05 M. The deconvolution is also shown. The data is shown in pink, the combined fit in maroon, with individual fits in blue. The difference of the fit spectrum and the actual spectrum is shown in orange.
