Figure 3.

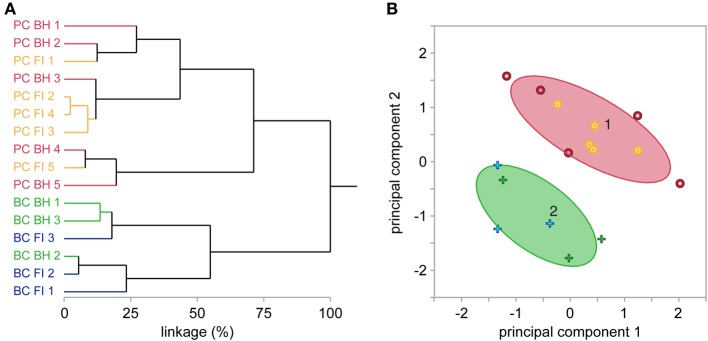
BH and FI reconstruction methods have similar overall morphometric performance. (A) Hierarchical clustering of the first 2 principal components of 27 morphological variables (see Methods) independently segregated all reconstructed cells into two major clusters, each exclusively containing PCs or BCs. Further subclusters did not segregate reconstructions from FI or BH. Taken together, this indicates their similarity for morphological cell classification. Each label on the y-axis is a reconstruction, with coloring indicating cell and method type. Linkage distance is plotted on the x-axis, indicating the level of dissimilarity between clusters. (B) In agreement, expectation-maximization clustering also separated BCs from PCs. Crosses denote BCs, and dots PCs. As in (A), coloring indicates reconstruction method (blue or yellow = FI; green or red = BH). Ovals denote the region where 90% of observations in each cluster are expected to fall.
