Figure 4.
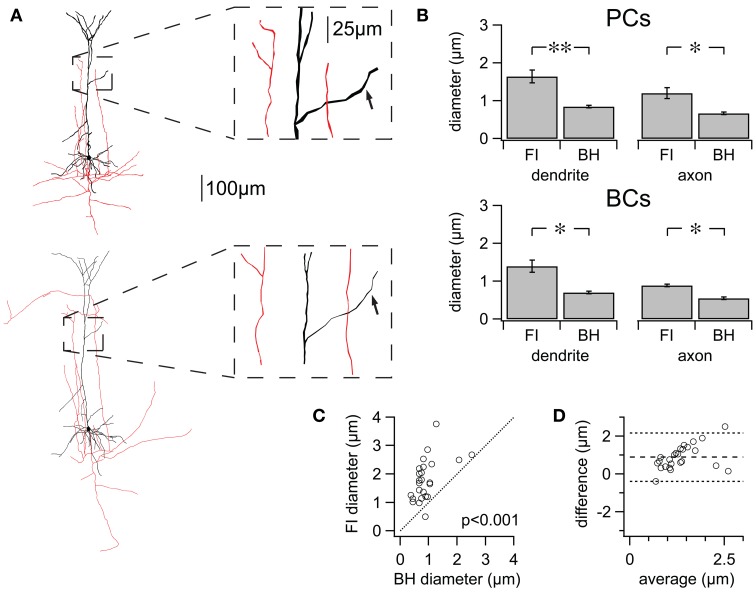
FI reconstructions suffer from systematically enlarged process diameters. (A) Two reconstructions of the same cell using FI (top) and BH (bottom). Inset: zoom highlighting differences in diameter for dendrite (black) and axon (red). Arrows in inset: example of matched dendritic locations, quantified in Figures 3C,D. (B) Average differences in process diameter for PCs and BCs using either method. FI reconstruction resulted in consistently larger diameter for PCs (n = 5 cell pairs, FI vs. BH; axon 1.20 ± 0.14 μm vs. 0.67 ± 0.04 μm, p < 0.05; dendrite 1.65 ± 0.17 μm vs. 0.84 ± 0.03 μm, p < 0.01) and BCs (n = 3 cell pairs; axon 0.89 ± 0.04 μm vs. 0.55 ± 0.04 μm, p < 0.05; dendrite 1.40 ± 0.16 μm vs. 0.71 ± 0.03 μm, p < 0.05). Average diameters for entire cells are found in Table 1. (C) Differences in diameter for manually matched dendritic locations using either method (see Figure 3A). All but one matched measurements were plotted above the line of equality, reflecting the tendency of FI reconstructions to have larger process diameter (PCs; n = 5 cell pairs; n = 25 segment pairs; FI vs. BH Diameter; mean 1.80 ± 0.15 μm vs. 0.91 ± 0.09 μm; p < 0.001). (D) The degree of agreement between the two methods is ascertained using a Bland-Altman or Tukey mean-difference plot (Bland and Altman, 1986). FI diameter—BH diameter is plotted against averaged process diameters, (FI+BH diameter)/2. Middle dotted line indicates a positive mean difference (0.89 ± 0.13 μm), showing that FI reconstructions consistently suffer from exaggerated process diameters. The upper and lower dotted lines indicate ±2SD and the 95% limits of agreement (SD = 0.64 μm). Linear regression (not shown) identified a significant slope (0.56; p < 0.05), showing that FI reconstruction overestimates diameters more for larger diameters. *p < 0.05, **p < 0.01.

