Figure 5.
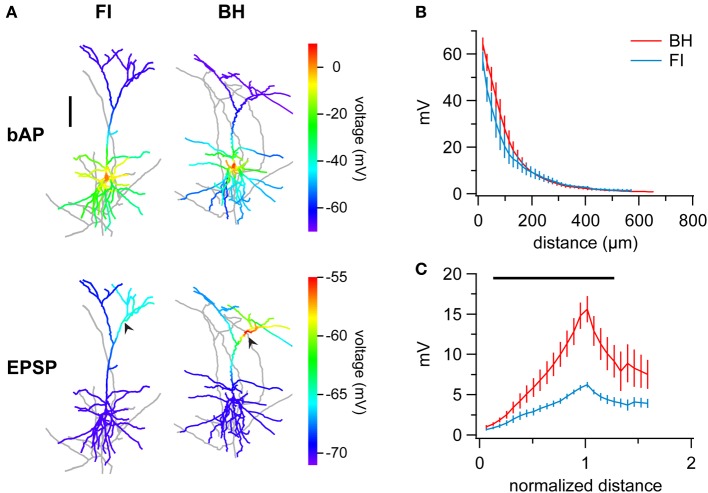
FI reconstructions introduce errors in multicompartmental computer models. (A) Sample reconstructions of the same cell indicating peak potentials resulting from of simulated back-propagating action potentials (bAPs) (top row) or forward-propagating EPSPs (bottom row). FI and BH reconstructions are on the left and right, respectively. Whilst bAP simulations are relatively similar, EPSP simulation results in smaller depolarization and local differences for the FI reconstruction. Arrows indicate the location of simulated synapses. Distal branches of morphologies are slightly cropped for clarity. (B) Ensemble averages of bAPs in PCs reconstructed using FI or BH, measured as peak amplitude at a given distance from the origin of the apical dendrite at the soma. Peak voltages were indistinguishable between methods at all distances. Vertical bars denote ± SEM. (C) Distance-normalized ensemble average of simulated forward-propagating EPSP amplitude in PCs reconstructed with either method shows a striking reduction of depolarizations in FI reconstructions. Distance from soma is normalized to the distance of the simulated synapse. Region of significance is indicated by black bar (paired t-test, p < 0.05).

