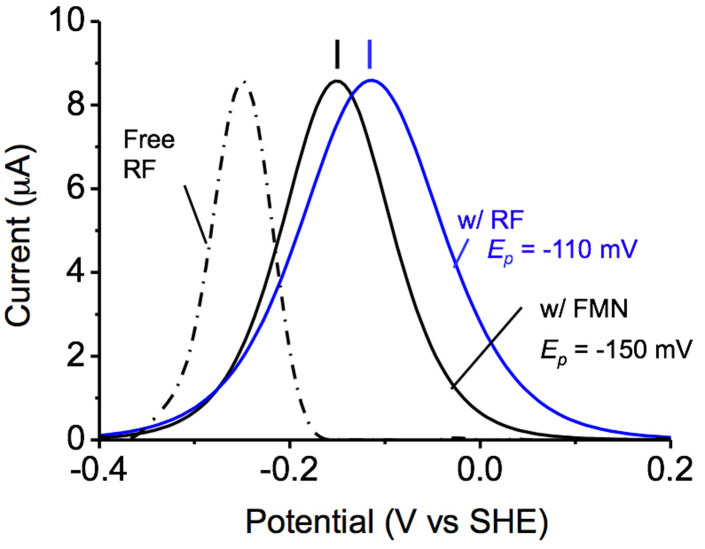
Figure 2. Differential pulse voltammogram for S. oneidensis MR-1 cells after 18 h of electrode cultivation at +0.4 V (vs. SHE) in the presence of 4.0 μM FMN (w/FMN, black line) and RF (w/RF, blue line).
The dotted line depicts the data points for the free RF solution. The peaks of the blue and black lines were deconvoluted from raw data in Figure S1 b and c, and the peak currents were normalized. The peak potential of electrochemical signals was described as Ep.

