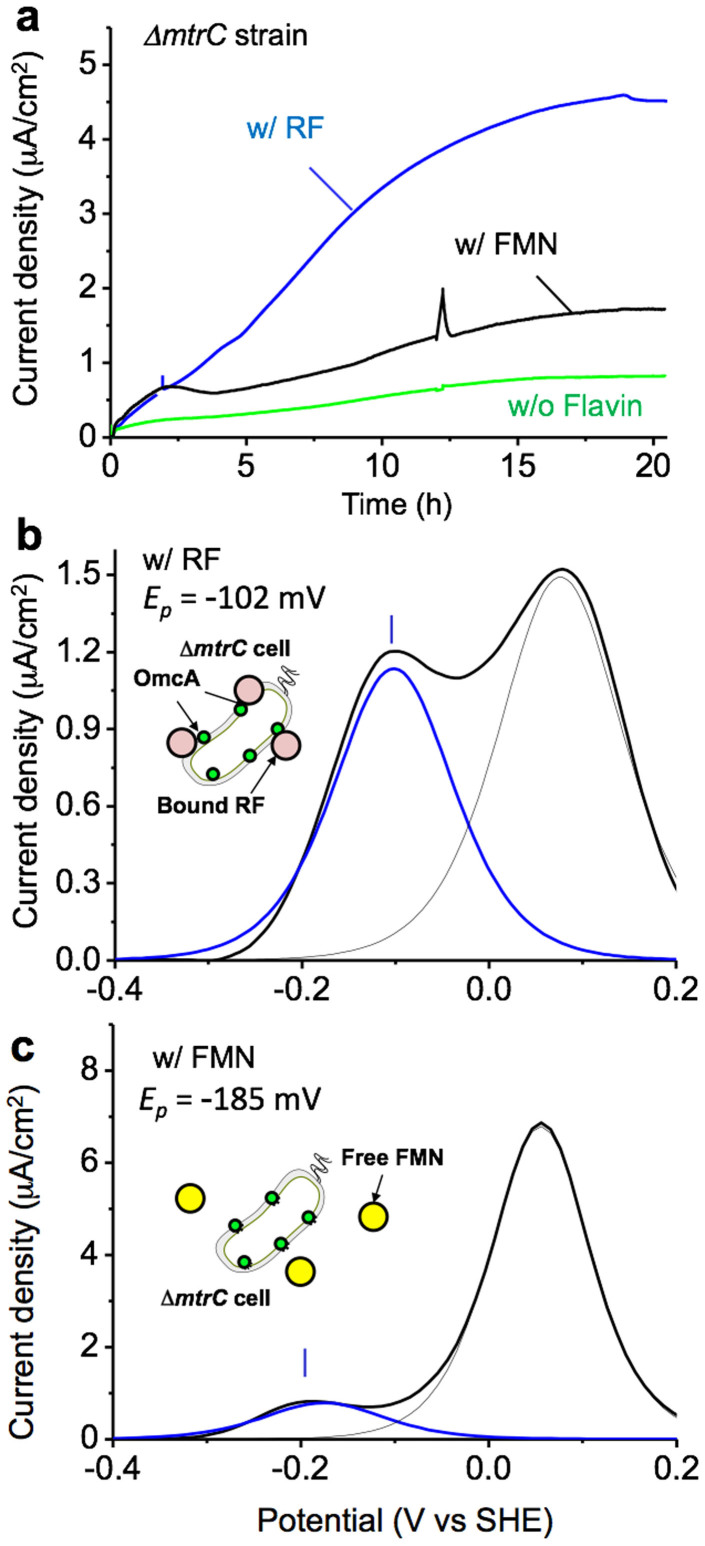
Figure 4.
(a) Microbial current production versus time for ΔmtrC cells of the S. oneidensis MR-1 strain inoculated in electrochemical cells with medium containing 10 mM lactate and either 2.0 μM FMN (w/FMN, black), 2.0 μM RF (w/RF, blue) or no addition of flavin (w/o Flavin, green). Baseline-subtracted differential pulse voltammetry for ΔomcA cells conducted at t = 21 h in panel a in the presence of 2.0 μM RF (b) and FMN (c). In panels b and c, the blue and black lines depict the data points for the flavin and heme redox reactions, respectively, deconvoluted from raw data shown as the solid black line. The same trend was reproduced at least three times in separated experiments.

