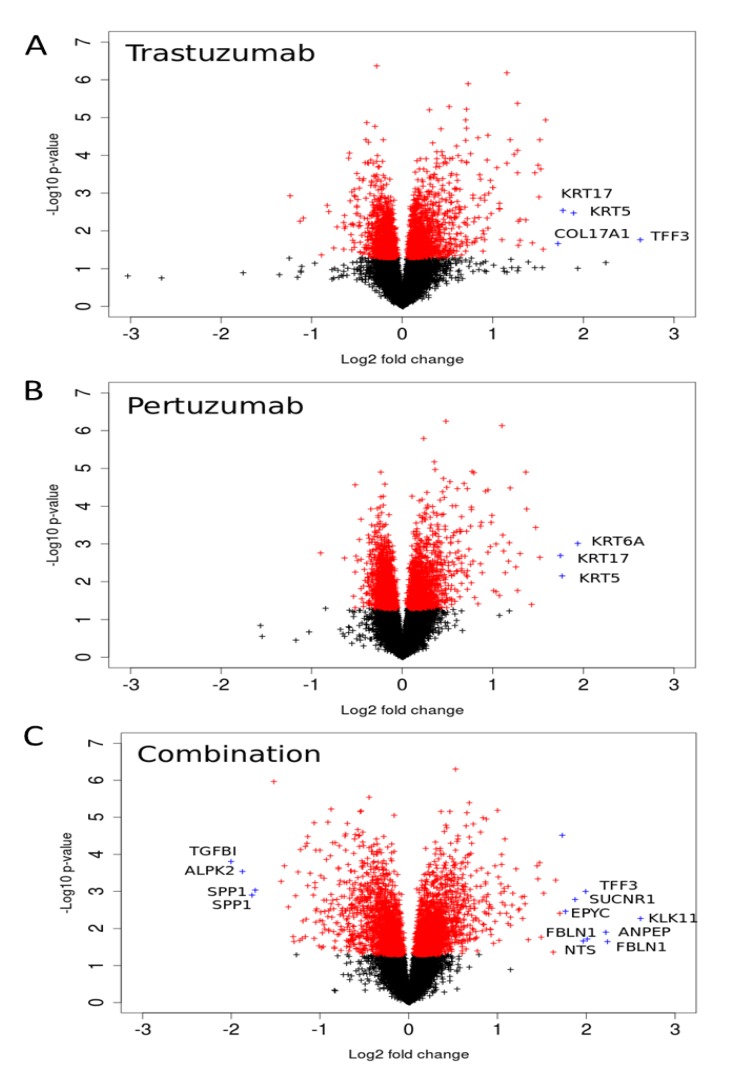
Figure 6.
Volcano-plots of gene expression following trastuzumab (A), pertuzumab (B), and their combination (C) treatment of SKOV3 ovarian xenograft tumour [28]. The genes with statistically significant (p-value < 0.05) and non-significant fold changes are coloured by red and, black, respectively. Genes with a high fold change are marked by blue crosses.

