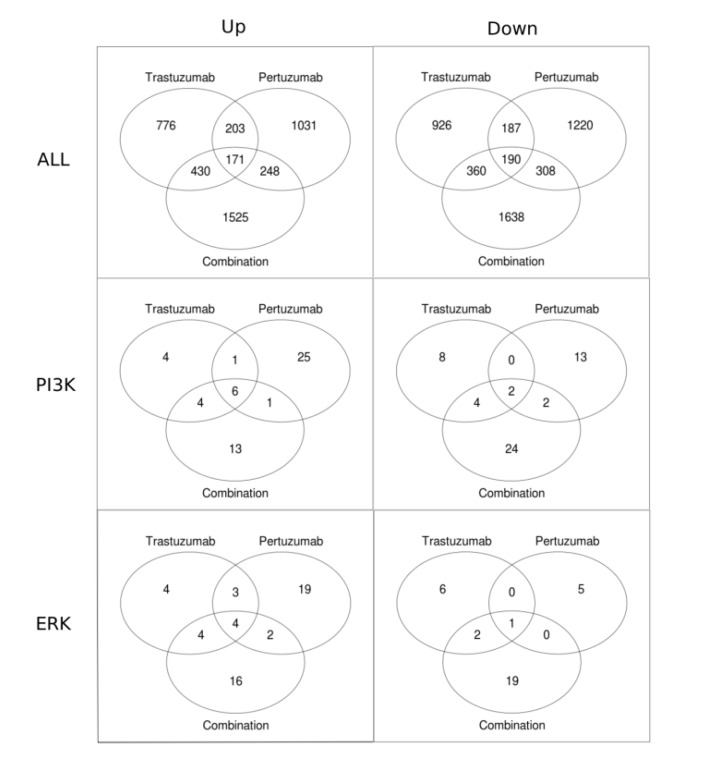
Figure 9.
Venn diagrams showing the numbers of genes with statistically significant fold change in trastuzumab, pertuzumab, and their combination treatments of SKOV3 ovarian xenograft tumour [28]. The first row of the figures contains all the genes up-regulated (left column) and down-regulated (right column). The second and the third rows show Venn diagrams for the genes associated with the PI3K/AKT and ERK1/2 pathways, respectively.

