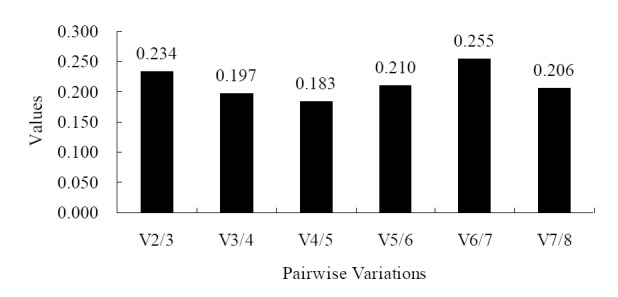
Figure 2.

Evaluation of the optimum number of reference genes according to the geNorm software. The magnitude of the change in the normalization factor after the inclusion of an additional reference gene reflects the improvement obtained. Vi/i+1 represent the models being compared: those with i and i+1 reference genes.
